EEM 4-day bullish forecast — Nov 15, 2026
- Bias: Bullish
- Timeframe: 4 days (made Nov 15, 2026, target date Nov 18, 2026)
- Price at analysis: $60.92
- Price target: $61.30
- Expected range: $59.90 – $62.40
- Result: Pending — graded after the close on Nov 18, 2026
Get a free AI analysis of EEM today
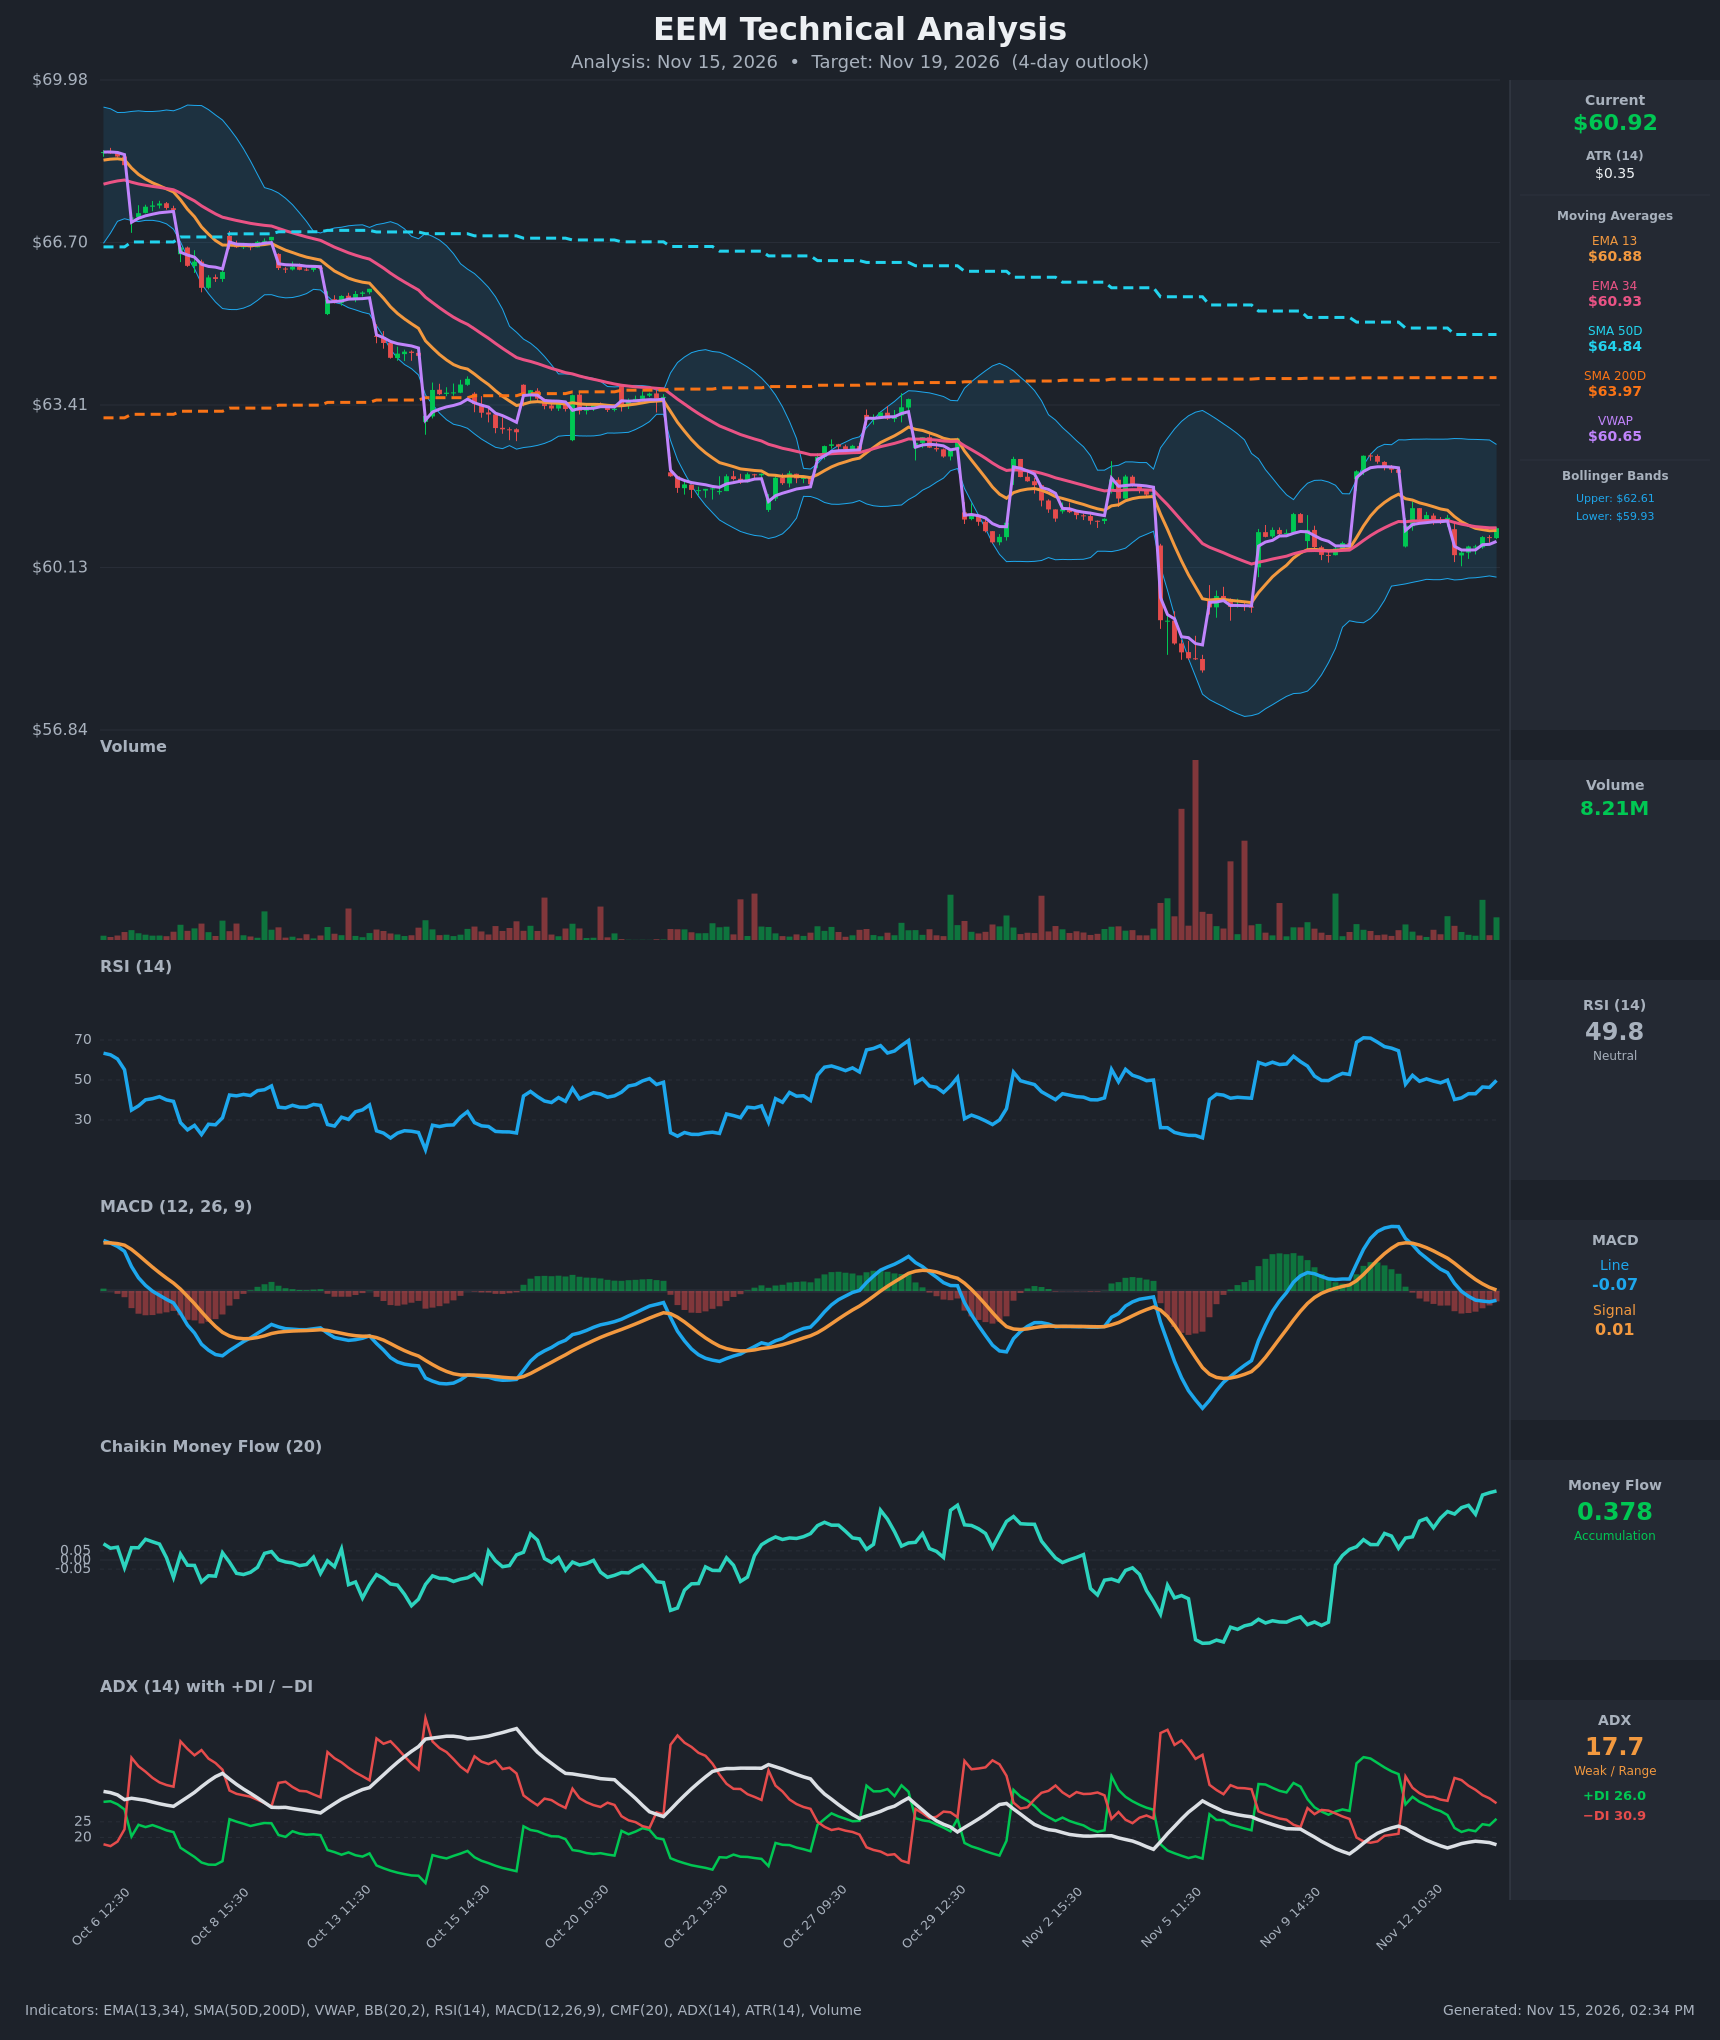
Analysis
TECHNICAL INDICATORS
- RSI (14): 49.78, dead neutral. It has recovered from 40.2 on Nov 13 morning and is rising again over the last few bars. Momentum is stabilizing rather than overbought or oversold. [Neutral]
- 20 EMA (EMA 13/34 used): EMA 13 is $60.88 and EMA 34 is $60.93, and price at $60.92 sits right on both. EMA 13 crossed below EMA 34 on Nov 13 (about 11:30), a mild bearish cross. The two are flat and converging, so there is no clear support or resistance edge. [Neutral]
- MACD: Line -0.072, signal +0.008, histogram about -0.080. The line crossed below the signal on Nov 13 and is below zero. The histogram has narrowed from -0.112 to -0.080 as the line flattens, so downside momentum is fading but no bullish cross has occurred. [Bearish]
- Bollinger Bands (20): Upper $62.61, lower $59.93, midline about $61.27. Price is in the lower-middle of the bands. The bands are wide after the Nov 5-6 selloff but starting to compress. There is room to the midline and upper band, with the lower band about $1.00 below. [Neutral]
- CMF (20): 0.378, strong accumulation. It has climbed steadily from a negative reading around Nov 5 to its highest level on the chart. This is the strongest bullish signal here, though it has not yet produced price follow-through. [Accumulation]
- ADX (14): 17.7 and falling, so the trend is weak or range-bound. −DI (30.9) is above +DI (26.0), a mild bearish lean, but the gap is narrowing from 39 vs 22 on Nov 13 morning. [Weak Trend, slight bearish lean]
- Volume: 8.21M, normal to slightly above average in recent bars. There were no distribution spikes after the Nov 5-6 capitulation volume, and recent green bars have decent participation. Price is above VWAP ($60.65), which shows modest intraday buying. [Mildly Bullish]
DIVERGENCES & TRENDS
- CMF vs. price: CMF is making new highs (0.378) while price is still below its Oct-Nov downtrend structure. This positive divergence suggests quiet accumulation.
- MACD: The histogram is improving from -0.112 to -0.080, which points to waning bearish momentum. A bullish crossover has not yet occurred.
- DI: −DI is still on top, but the spread has shrunk from 17 points to about 5. A +DI/−DI crossover is possible within the window.
- Moving averages: Price is well below SMA 50 ($64.84, falling) and SMA 200 ($63.97), so the longer-term trend is down. SMA 50 is still above SMA 200 but converging, a death cross risk that is not a near-term trigger.
- Trend structure: The chart shows a series of lower highs since early October. Since the Nov 5-6 low, price has made higher lows and is now chopping between about $60.40 and $62.40.
CHART PATTERNS
- Larger structure: The Oct-Nov decline roughly fits a descending channel or Bullish Falling Wedge from the reference diagram. Lower highs are compressing against a lower floor near the Nov 6 capitulation low. A break above the descending highs would target a retracement toward the $63.4-$64 area (SMA 200), but that is beyond a 4-day horizon.
- Near term: The last 6-7 sessions look like a small consolidation, or a symmetrical-triangle-style squeeze, between about $60.40 and $62.0-62.4. There is no clean textbook pattern, so the pattern signal is weak.
- Implication: A base is forming after a capitulation low, and the 4-day move is likely modest with a slight upward skew.
POTENTIAL SCENARIOS
- Scenario 1: Bullish Base Holds and Drifts Higher — CMF accumulation and an improving MACD histogram support a push toward the Bollinger midline and the Nov 11 highs. Trigger: hold above $60.40 and a close above $61.35 (the Nov 12 intraday high zone). Target: $61.30-$62.00. Invalidation: close below $60.38. (45% probability)
- Scenario 2: Neutral Range Chop — ADX below 20 and flat EMAs keep price pinned near the EMAs and VWAP. Trigger: no break of $60.40 or $62.00. Target: $60.60-$61.50. Invalidation: a break outside $60.38-$62.04 on volume. (30% probability)
- Scenario 3: Bearish Trend Resumption — −DI dominance, the negative MACD and price below both SMAs bring renewed selling. Trigger: a break below $60.38 with expanding volume. Target: $59.90-$59.60 (lower Bollinger Band area). Invalidation: reclaim of $61.35. (25% probability)
PRICE TARGETS
- Target Price: $61.30 (4-day horizon, about +0.6%)
- Expected Range: $59.90 to $62.40 (width $2.50, about 4.1% of current price, consistent with a 3-5 day timeframe)
- Key Levels: Support at $60.38, Resistance at $62.04
OVERALL BIAS
OVERALL BIAS: BULLISH - Strong and rising CMF accumulation (0.378), an improving MACD histogram, RSI turning up from 40 and price above VWAP outweigh the weak, fading −DI lean. Conviction is modest because price remains below the falling SMA 50 and SMA 200 and ADX shows no trend.
This is educational analysis and not financial advice.