MSTR 4-day bearish forecast — Nov 15, 2026
- Bias: Bearish
- Timeframe: 4 days (made Nov 15, 2026, target date Nov 18, 2026)
- Price at analysis: $111.59
- Price target: $109.80
- Expected range: $105.50 – $114.50
- Result: Pending — graded after the close on Nov 18, 2026
Get a free AI analysis of MSTR today
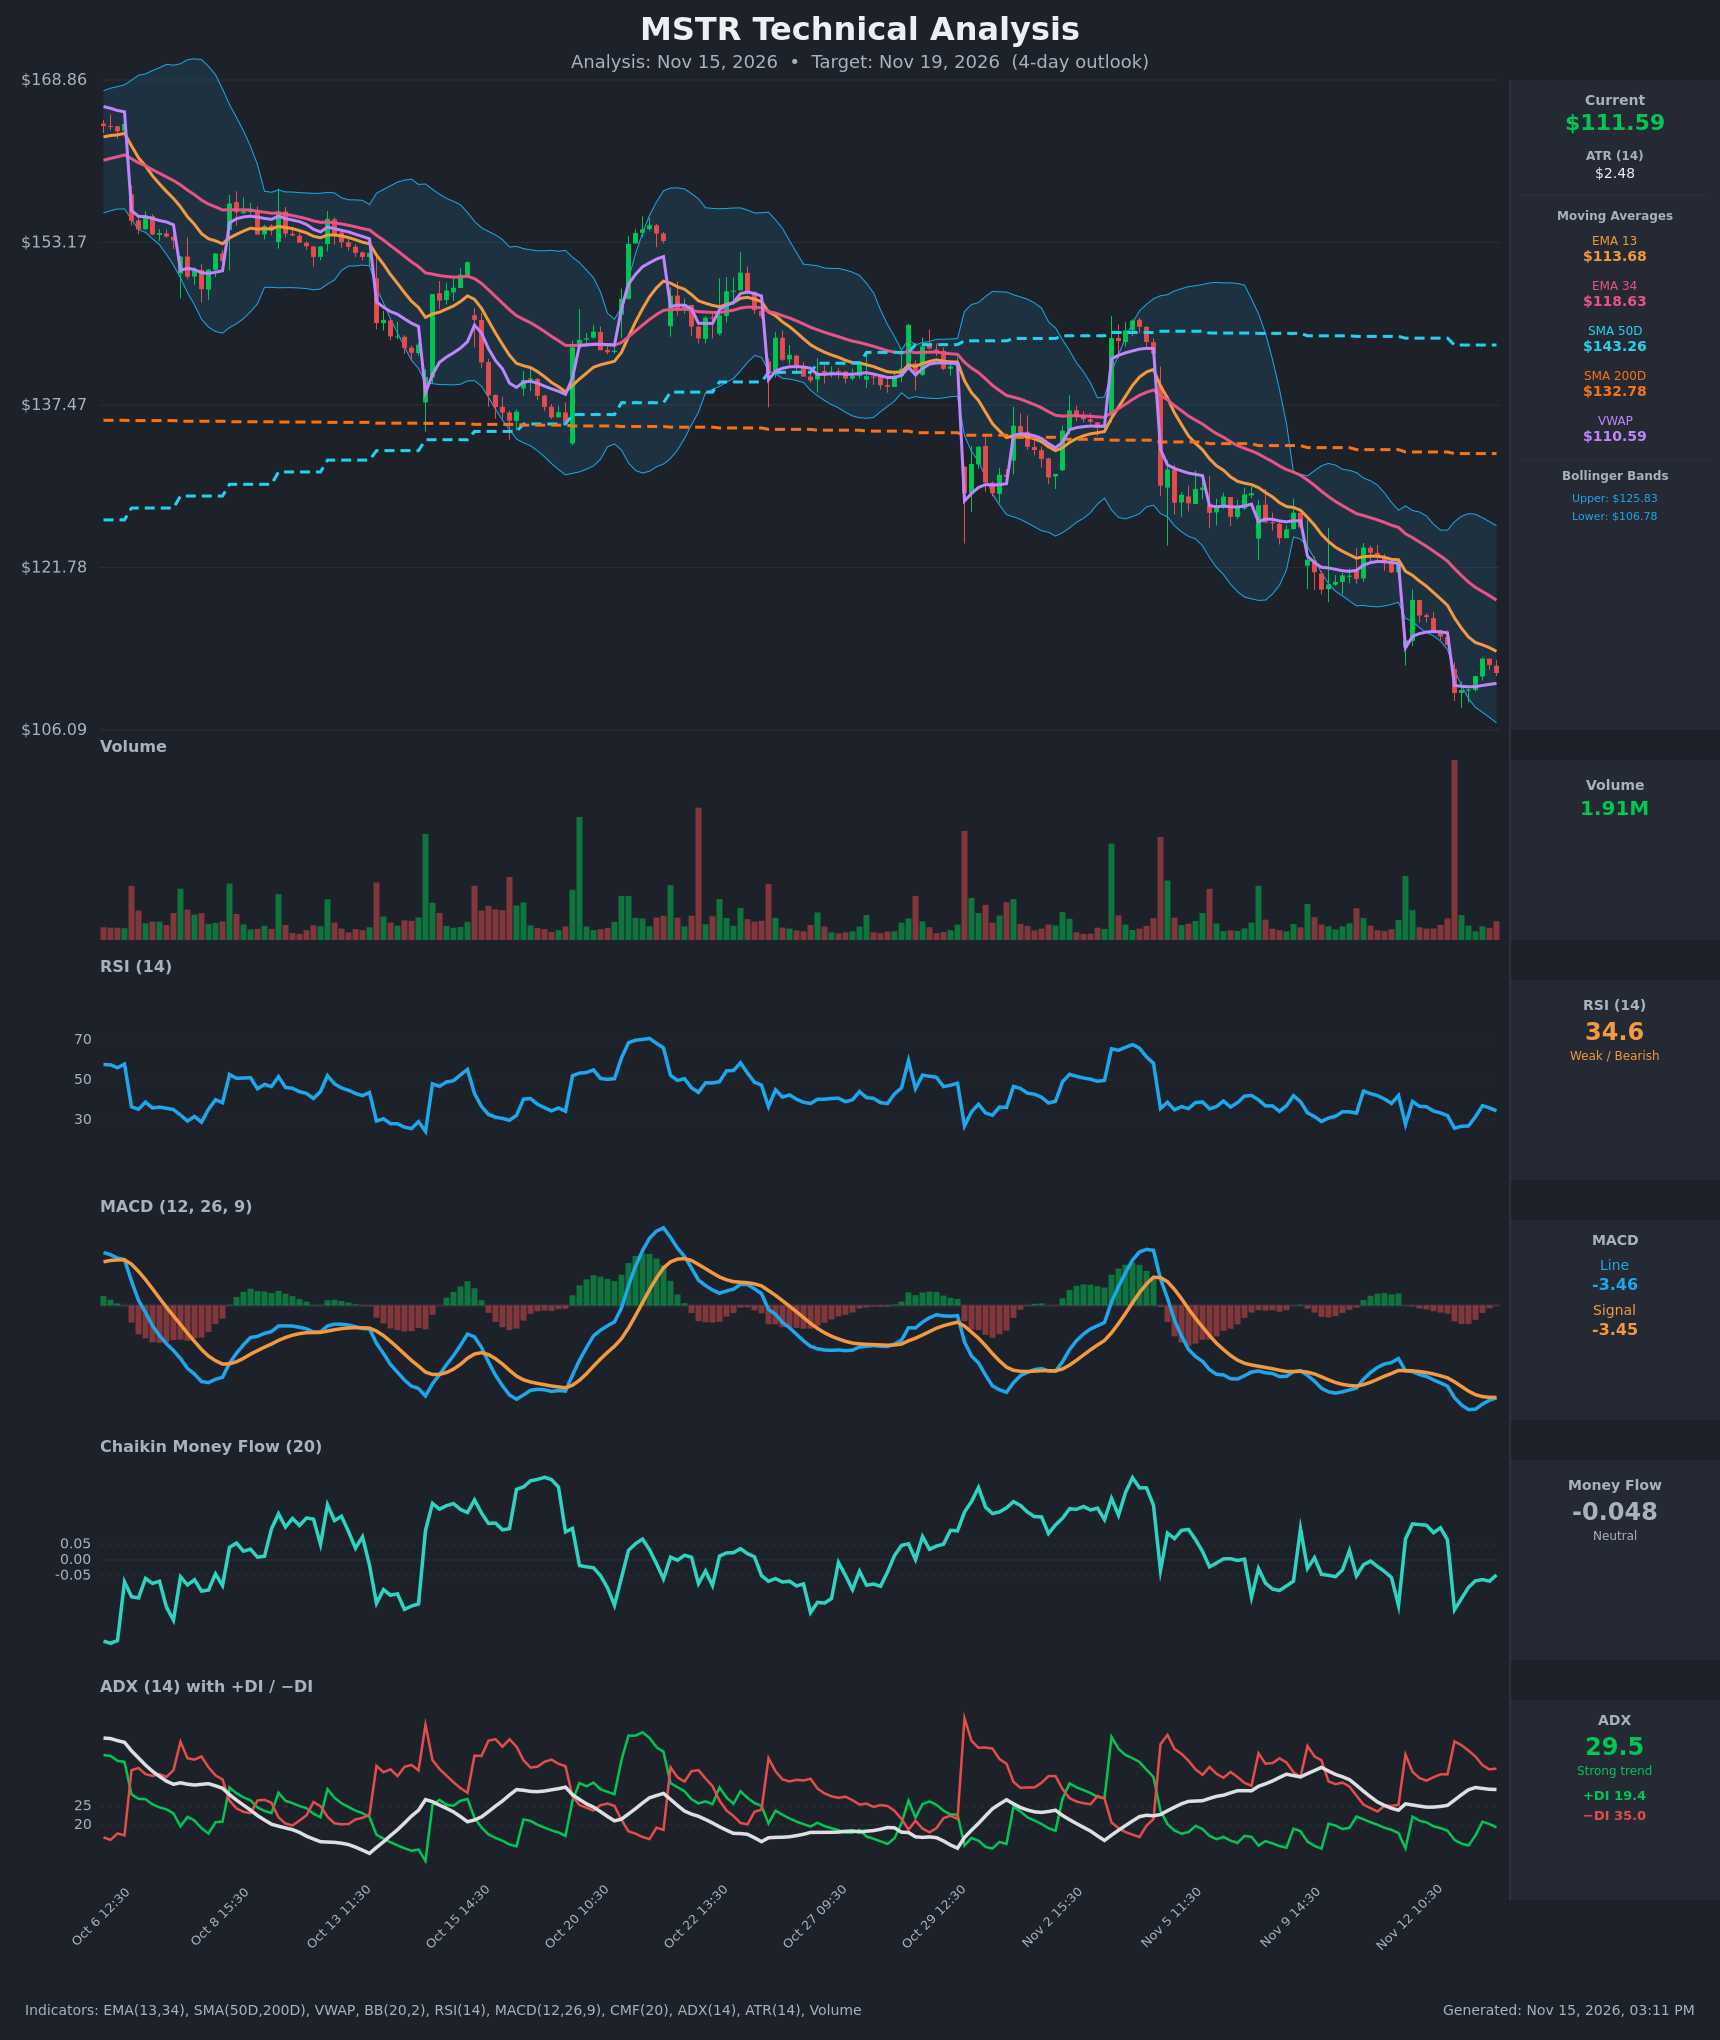
Analysis
TECHNICAL INDICATORS
- RSI (14): 34.57, close to oversold but not there. It bounced from 25.9 to 37.2 and has turned back down to 34.6, so momentum is weak and has not yet shown a durable reversal. [Bearish]
- 20 EMA: The chart shows EMA 13 at $113.68 and EMA 34 at $118.63 (no 20 EMA is given). Price at $111.59 is below both, and EMA 13 is below EMA 34, so both act as overhead resistance. [Bearish]
- MACD: Line -3.463 vs signal -3.447, so the line is marginally below the signal. The histogram is slightly negative at about -0.016 but has been narrowing after the line hit lows near -3.9. The line is attempting to curl up toward a crossover, but both lines are deep below zero. [Bearish]
- Bollinger Bands (20): Upper $125.83, lower $106.78, middle about $116.30. Price sits in the lower third, about $4.80 above the lower band. The bands are widening and sloping down, which fits a downtrend with price riding the lower half. [Bearish]
- CMF (20): -0.048, just inside the neutral zone and right at the distribution threshold. It has improved from the -0.159 low on Nov 13 but has stayed negative for the last several bars. [Neutral]
- ADX (14): 29.5 with −DI 35.0 well above +DI 19.4. This is a strong downtrend, although ADX has plateaued around 29-30 and +DI has recovered slightly from 14.5. [Strong Trend – Bearish]
- Volume: 1.91M on the latest bar, average to slightly below average. The big volume spike came on the Nov 12 selloff candle, and the recent bounce has come on modest volume, which suggests weak buying conviction. [Bearish/Neutral – bounce lacks conviction]
DIVERGENCES & TRENDS
- Price made a new low on Nov 13 (about $109.66) while RSI printed 25.9, and RSI has since made only a slightly higher low (about 27 on the second push). This is a mild, early sign of momentum stabilization, not a confirmed bullish divergence.
- MACD is flattening and trying to curl up toward the signal line. A bullish crossover is possible in the next session or two, but it would happen deep below zero, so it would be a weak signal.
- EMA 13 is below EMA 34, with a persistent gap of about $5. SMA50D ($143.26) is well above SMA200D ($132.78) even though price is far below both. That is a lagging structure, and a death cross is likely if the decline continues.
- Price is far below SMA200D, roughly 16% under it, so the long-term trend is down.
- Price is slightly above VWAP ($110.59) and has been pinned near it, so there is no strong directional edge from VWAP.
- DI spread is narrowing (35.0 vs 19.4 compared with 42.3 vs 16.0 earlier), which signals a slowing downtrend but no bullish control.
CHART PATTERNS
- The broader structure is a persistent descending channel with lower highs and lower lows from about $168 in early October to about $110. It is closest to a Bearish Flag/Pennant continuation at the recent consolidation near $109-$113, following the sharp drop on Nov 12-13.
- The tight range of $109.66-$113 since Nov 13 is a small base. A break below $109.66 would target roughly $105-$106, consistent with the lower Bollinger Band and ATR-scaled moves.
- A Bullish Falling Wedge could be argued if price breaks above EMA 13 (about $113.70), but it lacks confirmation: there is no volume surge and no breakout yet.
- Overall the pattern evidence leans toward continuation of the downtrend, with a possible relief bounce toward EMA 13 and EMA 34 that would act as resistance.
POTENTIAL SCENARIOS
- Scenario 1: Bearish Trend Continuation — Price fails at the EMA 13 around $113.70, rolls over, and breaks the recent low at $109.66 as −DI stays dominant. Trigger: close below $109.66. Target: $105-$107 (lower Bollinger Band area). Invalidation: close above $114 with rising volume. (50% probability)
- Scenario 2: Neutral Consolidation / Base-Building — Oversold conditions hold price between $108 and $114 as MACD flattens and the RSI low holds. Trigger: failure to break either $109.66 or $113.70. Target: $110-$113. Invalidation: break outside $108-$114 on volume. (20% probability)
- Scenario 3: Bullish Relief Bounce — A MACD bullish crossover plus an RSI bounce from near-oversold lifts price toward EMA 13 and EMA 34 resistance. Trigger: close above $113.70. Target: $117-$118.60 (EMA 34). Invalidation: reversal below $109.66. (30% probability)
PRICE TARGETS
- Target Price: $109.80 (4-day horizon)
- Expected Range: $105.50 to $114.50 (width $9.00, about 8.1% of current price, appropriate for a 4-day window given ATR of $2.48)
- Key Levels: Support at $109.66 (recent swing low), then $106.78 (lower Bollinger Band). Resistance at $113.68 (EMA 13), then $118.63 (EMA 34).
OVERALL BIAS
OVERALL BIAS: BEARISH - Price is below all key moving averages with −DI far above +DI, ADX at 29.5, and MACD still negative below its signal. The bounce has come on weak volume and is likely to stall at EMA 13, though near-oversold RSI limits the downside to a modest decline.
This is educational analysis and not financial advice.