MSTR 6-day bearish forecast — Nov 15, 2026
- Bias: Bearish
- Timeframe: 6 days (made Nov 15, 2026, target date Nov 20, 2026)
- Price at analysis: $111.59
- Price target: $108.50
- Expected range: $104.80 – $112.00
- Result: Pending — graded after the close on Nov 20, 2026
Get a free AI analysis of MSTR today
Analysis
TECHNICAL INDICATORS
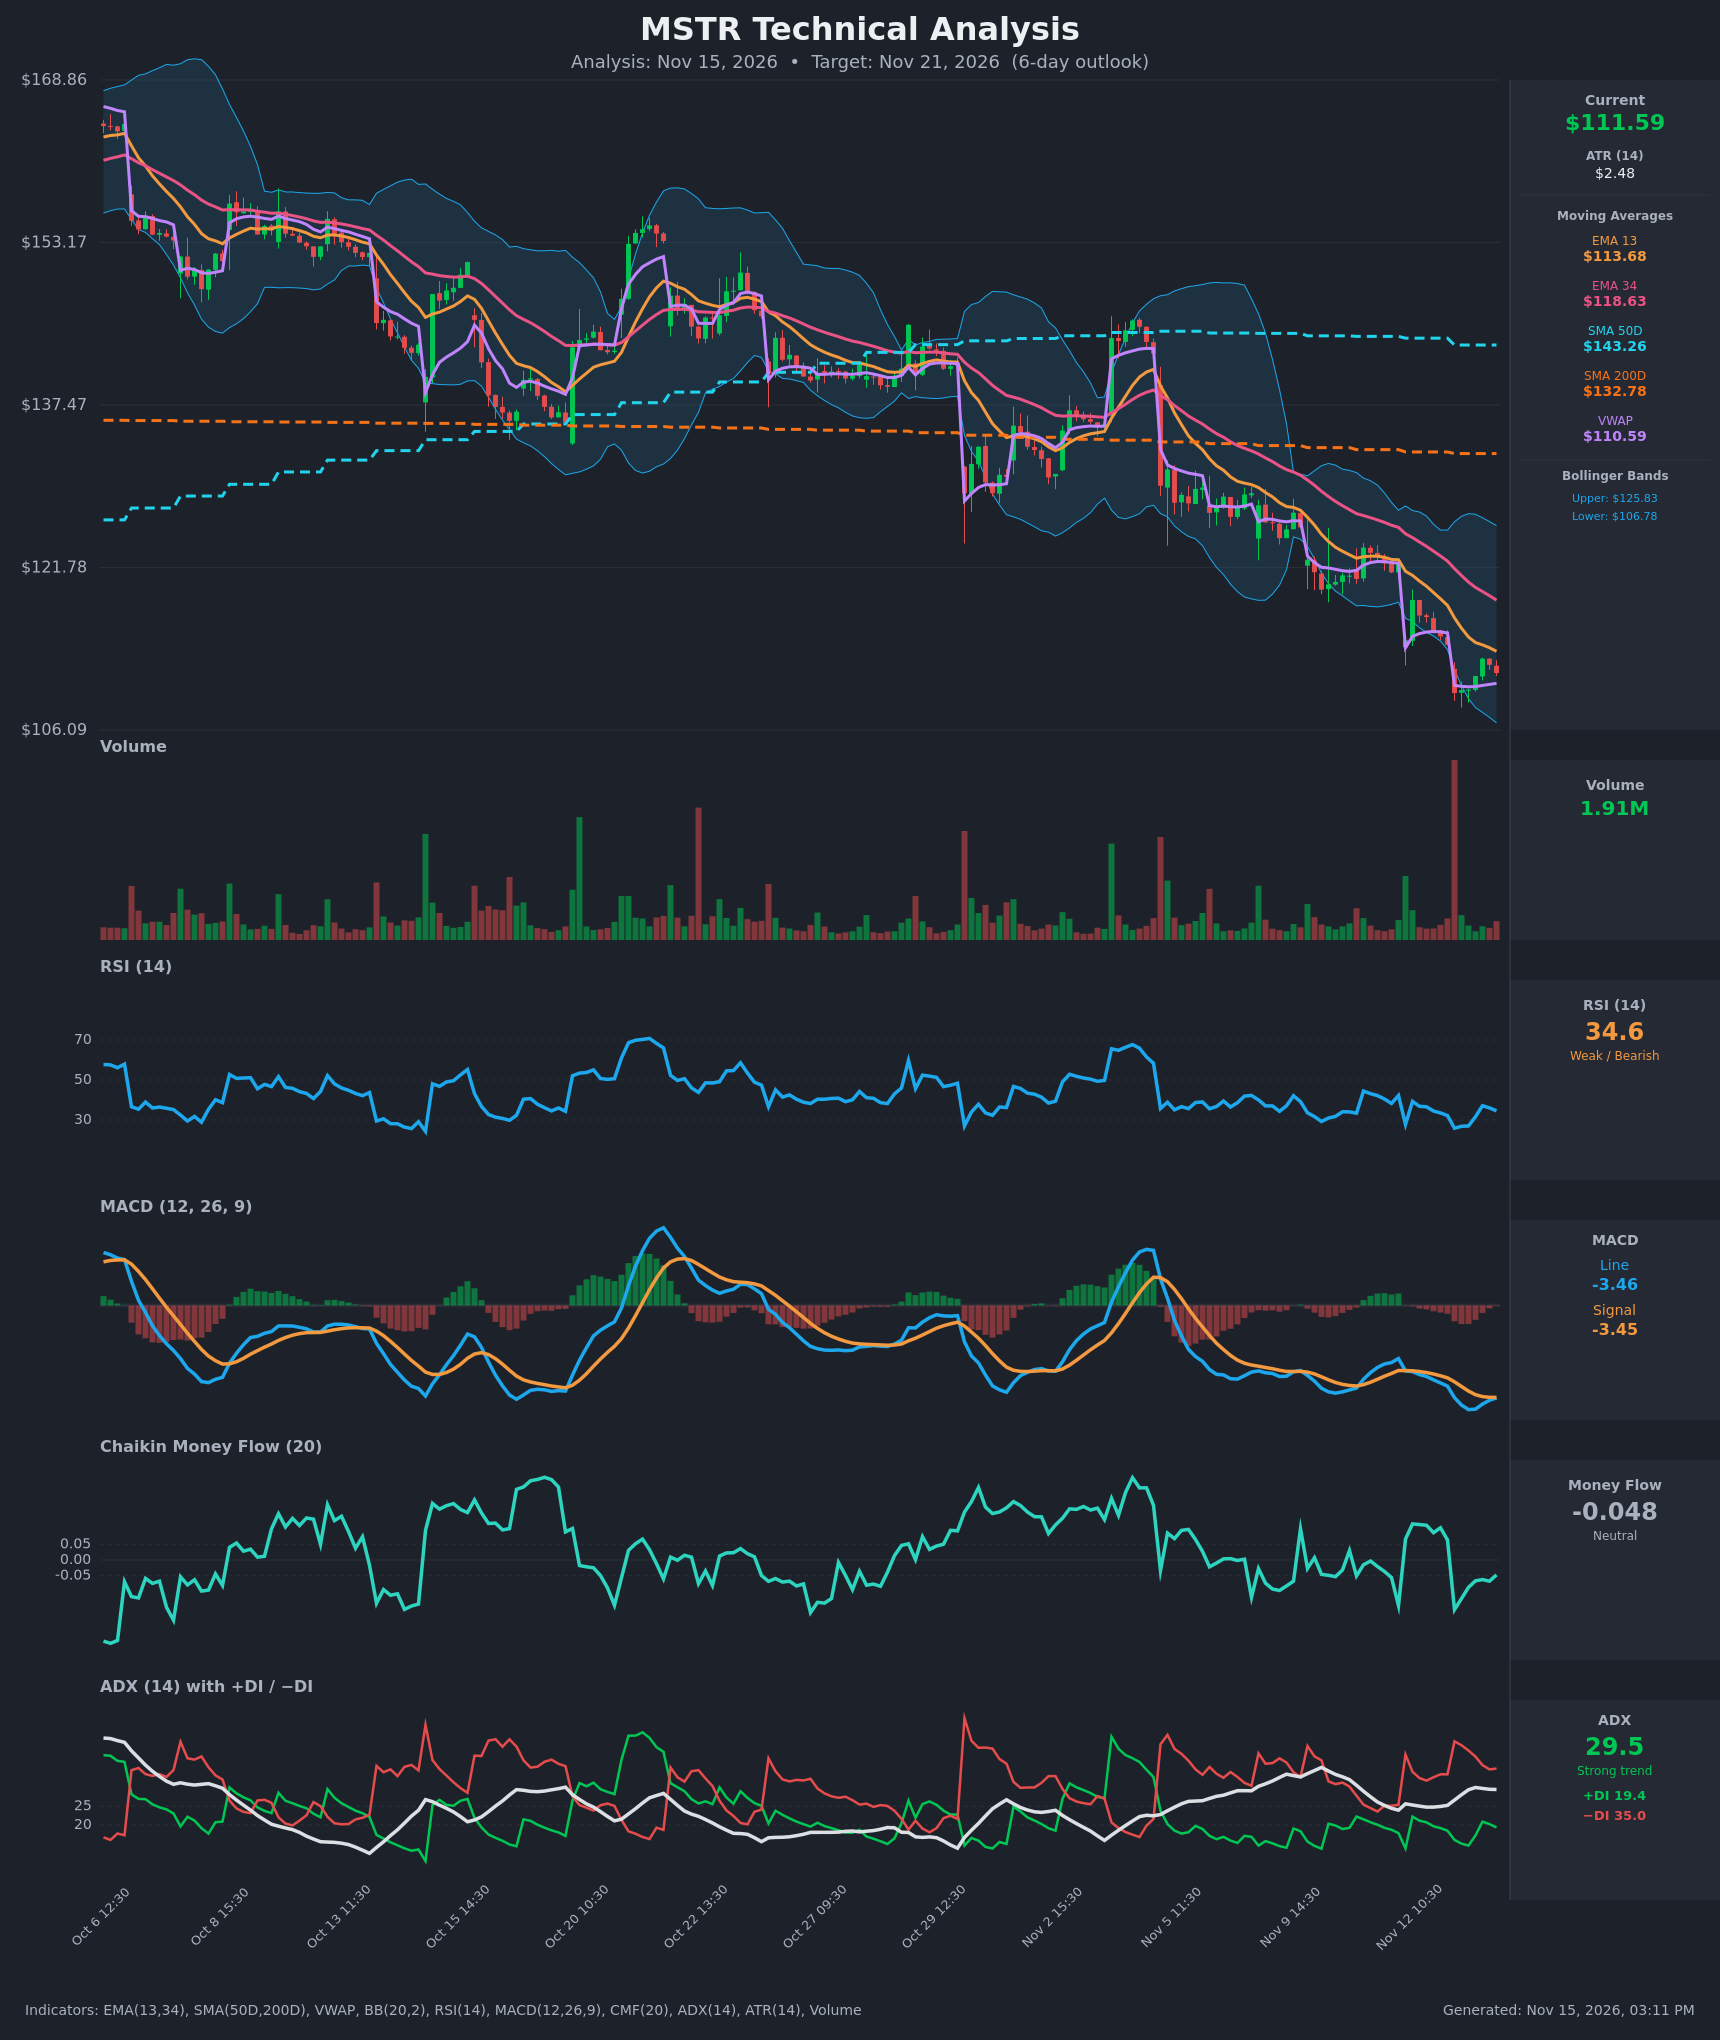
- RSI (14): 34.57, below 50 and just above the 30 oversold line. It bottomed near 26-27 on Nov 13 and has bounced only modestly, so momentum is weak but not yet stretched. Lower-high bounces in RSI have been typical through this downtrend. [Bearish]
- 20 EMA: Using the supplied EMA 13 of $113.68 (and EMA 34 of $118.63), price at $111.59 is below both. Both are falling and stacked bearishly (13 < 34), so they act as overhead resistance. [Bearish]
- MACD: Line -3.463 vs signal -3.447, a histogram of about -0.016, and both below zero. The histogram has shrunk from about -0.6 to nearly flat, so downside momentum is fading. The line is still marginally below the signal, so there is no bullish cross yet. [Bearish]
- Bollinger Bands (20): Upper $125.83, lower $106.78, with price in the lower third of the bands, about $4.80 above the lower band. The bands are sloping down, which marks a "walking the band" downtrend. A touch of the lower band is possible, but there is no reversal signal. [Bearish]
- CMF (20): -0.048, just inside the neutral zone and close to the -0.05 distribution threshold. It was positive (+0.06 to +0.12) on Nov 12 and has slipped back negative, so buying has not persisted. [Neutral]
- ADX (14): 29.5 and rising from the low 20s, which is a strong trend. −DI (35.0) is well above +DI (19.4), so bears are firmly in control. [Strong Trend – Bearish]
- Volume: 1.91M, modest and below the capitulation-type spike near the Nov 12 open. The bounce from $109.66 to $112.97 came on fading volume, which suggests weak buying conviction. VWAP is $110.59, and price sits only just above it. [Neutral-to-Bearish]
DIVERGENCES & TRENDS
- There is no clear bullish RSI divergence. The Nov 13 low (about $109.66) came with an RSI of about 26, lower than earlier RSI lows in the 27-30 area, which confirms rather than diverges from price.
- MACD histogram contraction is an early sign of selling exhaustion, and a bullish MACD cross is near. In a strong ADX trend such crosses often fail beneath the falling EMAs.
- Price has made consistent lower highs and lower lows since early October, with repeated rejections at EMA 34 and gap-downs.
- A death cross is in place. SMA50D ($143.26) is far above SMA200D ($132.78), but both are above price, and price is about 16% below SMA200D. This is a long-term downtrend.
- EMA 13 is below EMA 34, a bearish alignment, and the gap is widening.
- The DI spread (−DI 35 vs +DI 19) shows no bullish DI crossover.
- Price is holding slightly above VWAP, a minor sign of stabilization, but it is hovering right on that line.
CHART PATTERNS
- Bearish Flag / Pennant (continuation): The small, shallow consolidation and bounce after the sharp Nov 12-13 drop resembles the bearish flag/pennant in the reference. A breakdown below about $109.66 would imply a measured move of roughly $5-7 lower, toward $104-106.
- Descending channel / stair-step decline: Price is steadily making lower highs and lower lows under falling EMAs, which is a trend-continuation structure. A bullish falling wedge reversal would need a clear break above EMA 13/34 on rising volume, and that is not present.
- The lower Bollinger Band near $106.78 is the first logical downside magnet.
POTENTIAL SCENARIOS
- Scenario 1: Bearish Trend Continuation — Price fails at the falling EMA 13 (~$113.7) and VWAP, then rolls over as −DI stays dominant and ADX rises. Trigger: break below $109.66 on increased volume. Target: $106.78 (lower BB), with an extension to $104.5-105. Invalidation: a close above $114 (EMA 13) with MACD turning positive. (55% probability)
- Scenario 2: Bullish Oversold Relief Bounce — The MACD histogram turns positive, RSI curls up from the 30s, and price squeezes toward the declining EMAs. Trigger: a hold above $110.59 (VWAP) and a push through $113. Target: $113.7-$118.6 (EMA 13 to EMA 34). Invalidation: loss of $109.66. (30% probability)
- Scenario 3: Neutral Choppy Consolidation — Price drifts between VWAP and EMA 13 as CMF stays near zero and volume dries up. Trigger: range holding between $109.66 and $113.68. Target: $110-$113. Invalidation: a close outside the range on a daily basis. (15% probability)
PRICE TARGETS
For the 6-day horizon (Nov 21, 2026):
- Target Price: $108.50
- Expected Range: $104.80 to $112.00 (width $7.20, about 6.5% of the current price, consistent with the 7-10 day range guidance scaled down for 6 days)
- Key Levels: Support at $109.66 (recent low; next at $106.78, lower BB), Resistance at $113.68 (EMA 13; next at $118.63, EMA 34)
OVERALL BIAS
OVERALL BIAS: BEARISH - Price sits below all major moving averages with ADX at 29.5 and −DI far above +DI, and the post-drop bounce is a low-volume flag-like consolidation. Fading MACD downside momentum and proximity to the lower Bollinger Band argue for caution and a possible relief bounce, but the trend evidence favors a drift lower toward about $108.50.
This is educational analysis and not financial advice.