SLV 4-day bearish forecast — Nov 15, 2026
- Bias: Bearish
- Timeframe: 4 days (made Nov 15, 2026, target date Nov 18, 2026)
- Price at analysis: $44.13
- Price target: $43.55
- Expected range: $42.65 – $44.90
- Result: Pending — graded after the close on Nov 18, 2026
Get a free AI analysis of SLV today
Analysis
TECHNICAL INDICATORS
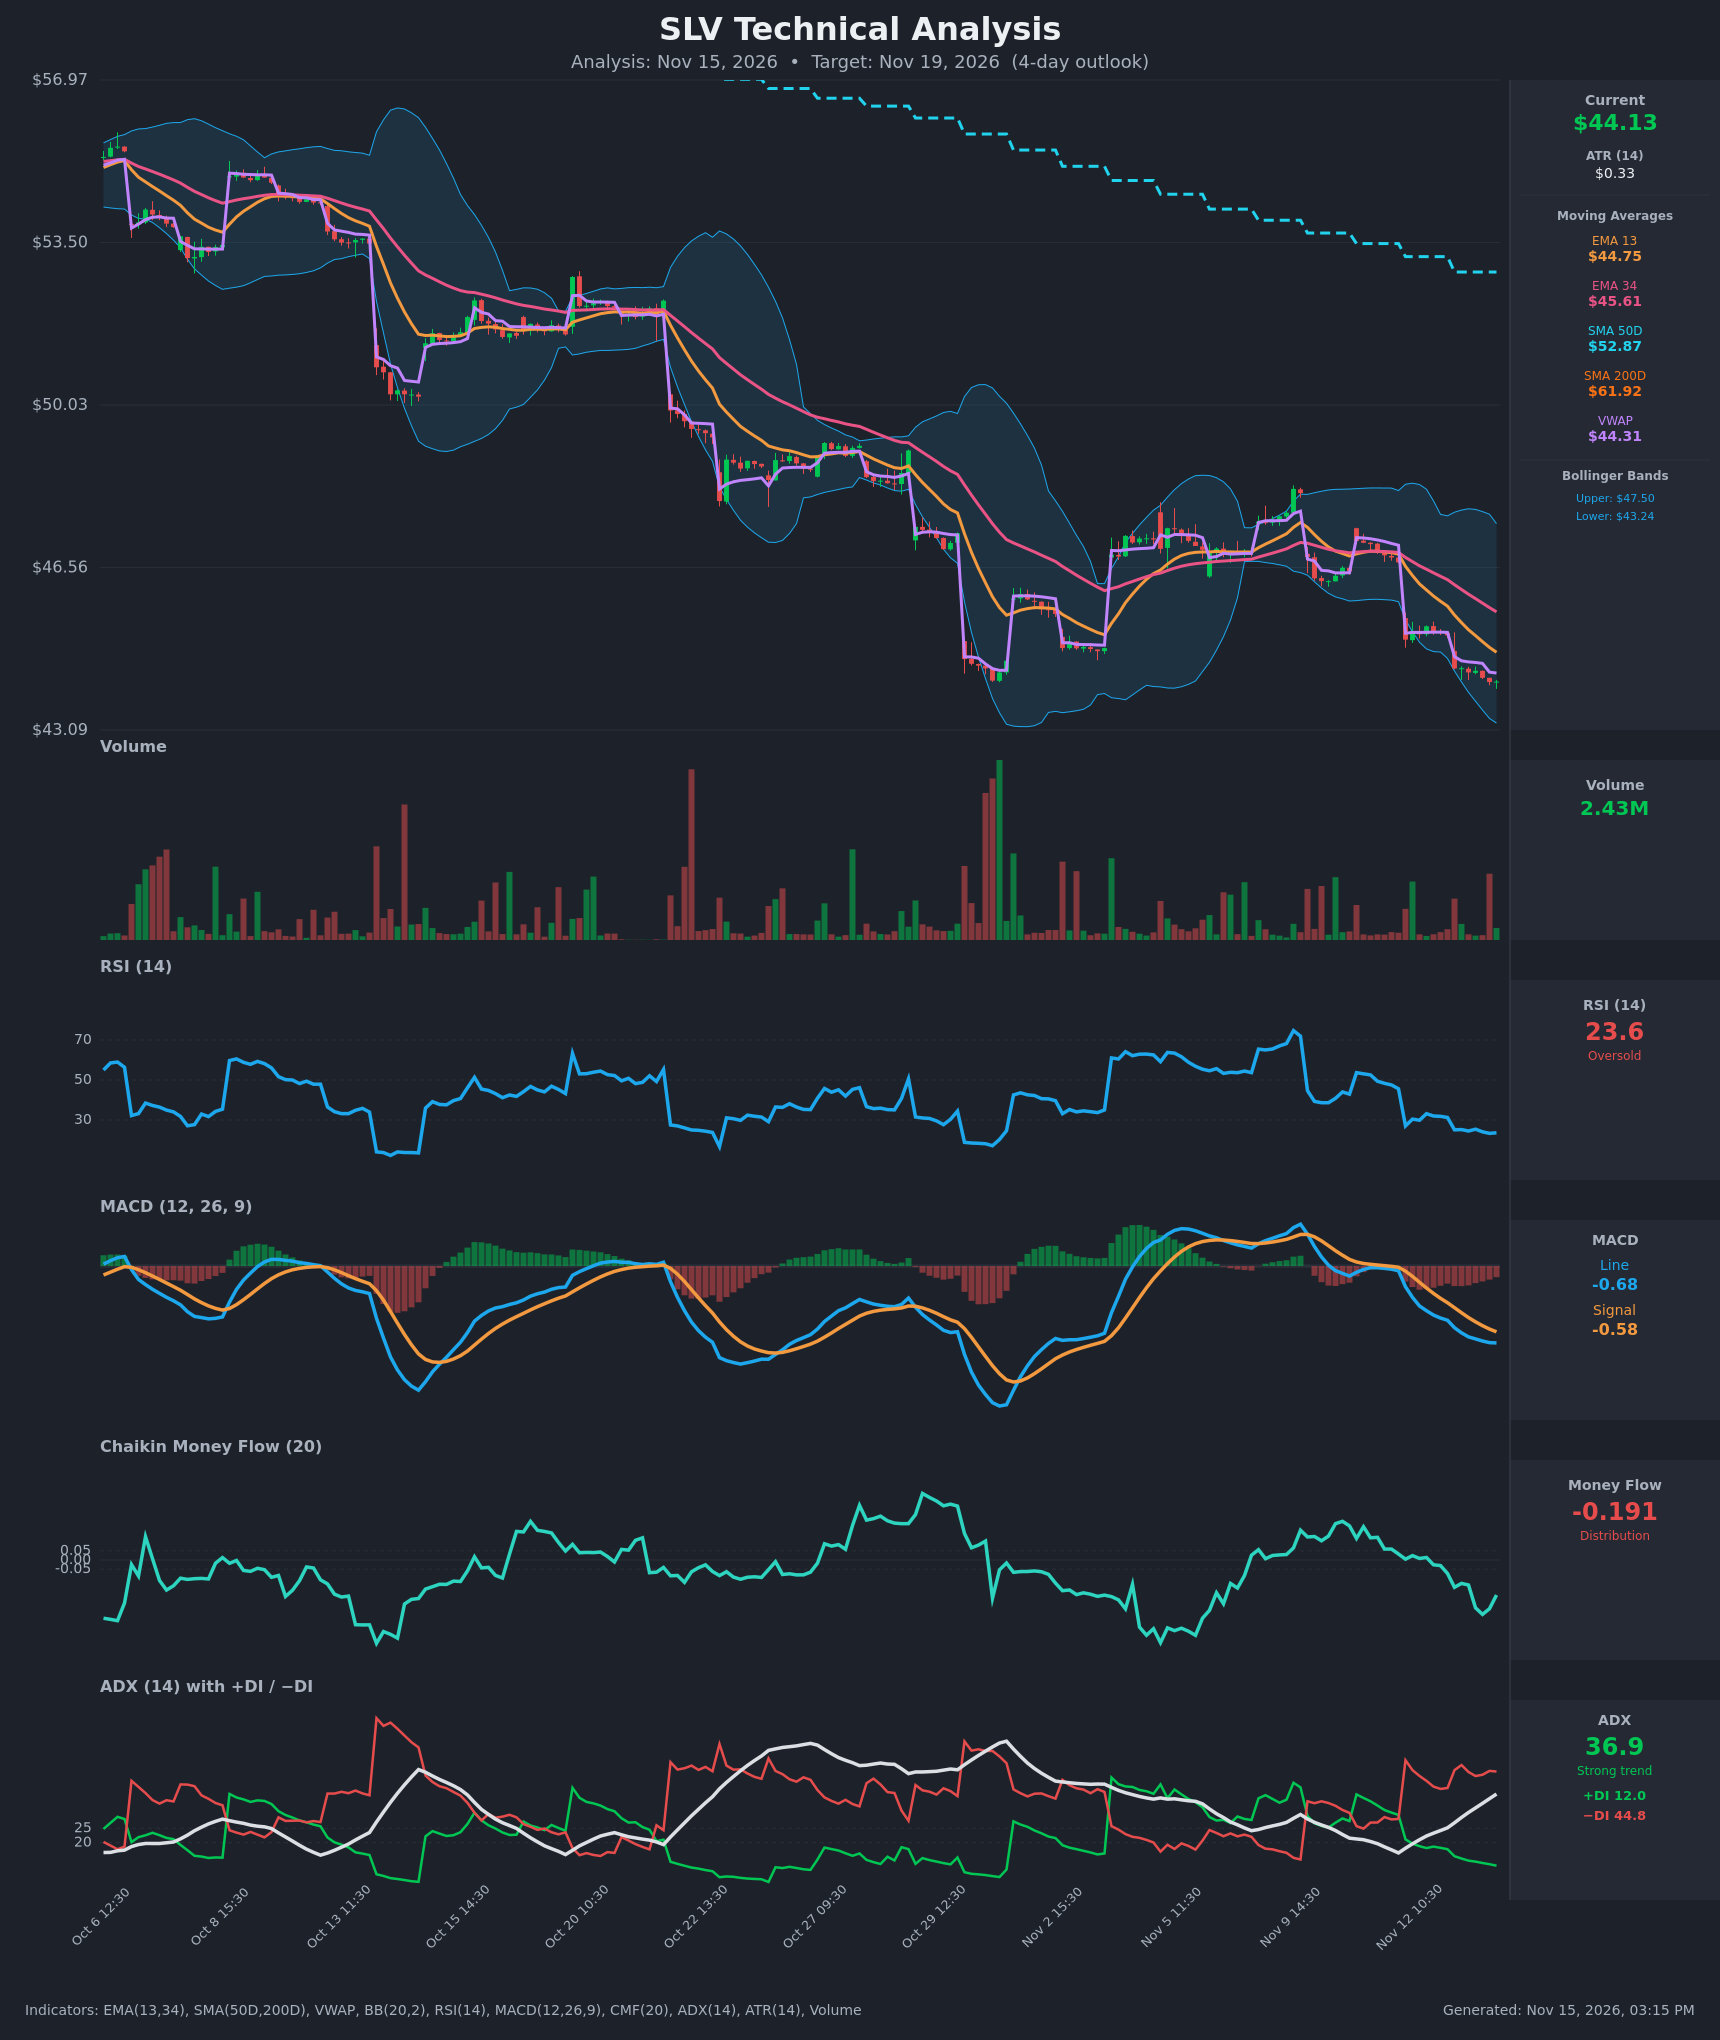
- RSI (14): 23.61, deeply oversold and still pinned below 30 for most of the last 15 bars (a brief spike to 33 failed). Momentum is still falling, with no bullish divergence yet. Oversold readings in a strong downtrend can persist, but they raise the odds of a relief bounce. [Bearish]
- 20 EMA: The data gives EMA 13 at $44.75 and EMA 34 at $45.61. Price at $44.13 is below both, and EMA13 is below EMA34 and sloping down, so both act as overhead resistance. The EMA13/EMA34 spread is widening, which confirms downside momentum. [Bearish]
- MACD: Line -0.683 is below signal -0.585, giving a histogram of about -0.098. The histogram has widened for several consecutive bars after the bearish crossover. Both lines are below zero and falling. [Bearish]
- Bollinger Bands (20): Upper $47.50, lower $43.24. Price is in the lower quarter of the band, about $0.89 above the lower band, and the bands are starting to expand downward. Price is walking the lower half of the bands, which signals trend continuation more than reversal. A tag of the lower band is likely, and the band offers little bounce evidence until price closes back above the midline. [Bearish]
- CMF (20): -0.191, well below -0.05. It was near zero on Nov 12 and has worsened to the -0.15 to -0.30 range, so selling pressure is increasing. [Distribution]
- ADX (14): 36.9 and rising steadily from 16 to 37 over the sample. −DI (44.8) is far above +DI (12.0), and +DI has been falling. This is a strong, accelerating downtrend with bears firmly in control. [Strong Trend – Bearish]
- Volume: 2.43M on the latest bar, with the heaviest volume on red (down) bars during the recent selloff legs. Volume is not showing capitulation-style climax buying. VWAP at $44.31 sits just above price, so sellers are in control intraday. [Bearish – selling pressure persists]
DIVERGENCES & TRENDS
- There is no bullish divergence. RSI is making lower lows alongside price, and MACD is making lower lows too, so momentum confirms price.
- The long-term structure is bearish. SMA50D ($52.87) is far below SMA200D ($61.92), a death cross already in place, and price is about 29% below SMA200D. EMA13 is below EMA34, and price is below the EMA13/34 and VWAP stack.
- ADX is rising above 25 with −DI dominant, so the trend is strengthening rather than exhausting.
- The Nov 12–13 intraday sequence shows stair-step lower highs and lower lows, with each bounce stalling under the falling EMA13.
- The main counter-signal is a stretched RSI (<25) with price near the lower Bollinger Band. This points to a possible short-lived mean-reversion bounce toward VWAP and EMA13 ($44.31–$44.75), but it does not change the trend.
CHART PATTERNS
- Price is in a persistent descending channel of lower highs and lower lows. The Nov 12–13 consolidation near $44.1–$45.3 after a sharp drop resembles a Bearish Flag/Pennant from the reference diagram, which is a continuation pattern.
- The flag's measured move implies a drop toward the lower Bollinger Band ($43.24) and possibly lower. Beyond that is the low-$43s zone from the prior swing.
- There is no reversal pattern (double bottom, inverted head and shoulders, falling wedge) confirmed. A falling wedge would need decelerating lows and a break above the upper trendline, near EMA13 around $44.75.
POTENTIAL SCENARIOS
- Scenario 1: Bearish Trend Continuation — Sellers keep control (−DI dominant, ADX rising, CMF negative) and price tests the lower Bollinger Band and probes below it. Trigger: failure to reclaim VWAP ($44.31) and a break below $43.90. Target: $43.24, then $42.80 to $43.00. Invalidation: a close above $44.75 (EMA13) on rising volume. (55% probability)
- Scenario 2: Bullish Oversold Relief Bounce — RSI at 23.6 triggers short covering and mean reversion toward VWAP and the falling EMA13. Trigger: a hold above $43.80 with an intraday reclaim of $44.31. Target: $44.75 to $45.00, with a possible extension to EMA34 at $45.61 at most. Invalidation: rejection at EMA13 or a break below $43.50. (35% probability)
- Scenario 3: Neutral Choppy Basing — Price stalls and oscillates between the lower band and VWAP while indicators reset. Trigger: ADX flattening and RSI curling up from below 30. Target: $43.60 to $44.50. Invalidation: a decisive break beyond either end of that range. (10% probability)
PRICE TARGETS
- Target Price: $43.55 (4-day horizon, about -1.3% from $44.125)
- Expected Range: $42.65 to $44.90 (width $2.25, about 5.1% of current price, appropriate for a 4-day window with ATR of $0.33)
- Key Levels: Support at $43.24 (lower Bollinger Band), Resistance at $44.75 (EMA 13, with VWAP at $44.31 as first hurdle)
OVERALL BIAS
OVERALL BIAS: BEARISH - A strong, accelerating downtrend (ADX 36.9 with −DI 44.8 vs +DI 12.0), a negative MACD, CMF distribution and a price stack below all key averages favor further downside. The oversold RSI (23.6) argues for a modest target and a possible bounce toward $44.75 first, so conviction is moderate.
This is educational analysis and not financial advice.