SLV 6-day bearish forecast — Nov 15, 2026
- Bias: Bearish
- Timeframe: 6 days (made Nov 15, 2026, target date Nov 20, 2026)
- Price at analysis: $44.13
- Price target: $43.60
- Expected range: $42.45 – $44.95
- Result: Pending — graded after the close on Nov 20, 2026
Get a free AI analysis of SLV today
Analysis
TECHNICAL INDICATORS
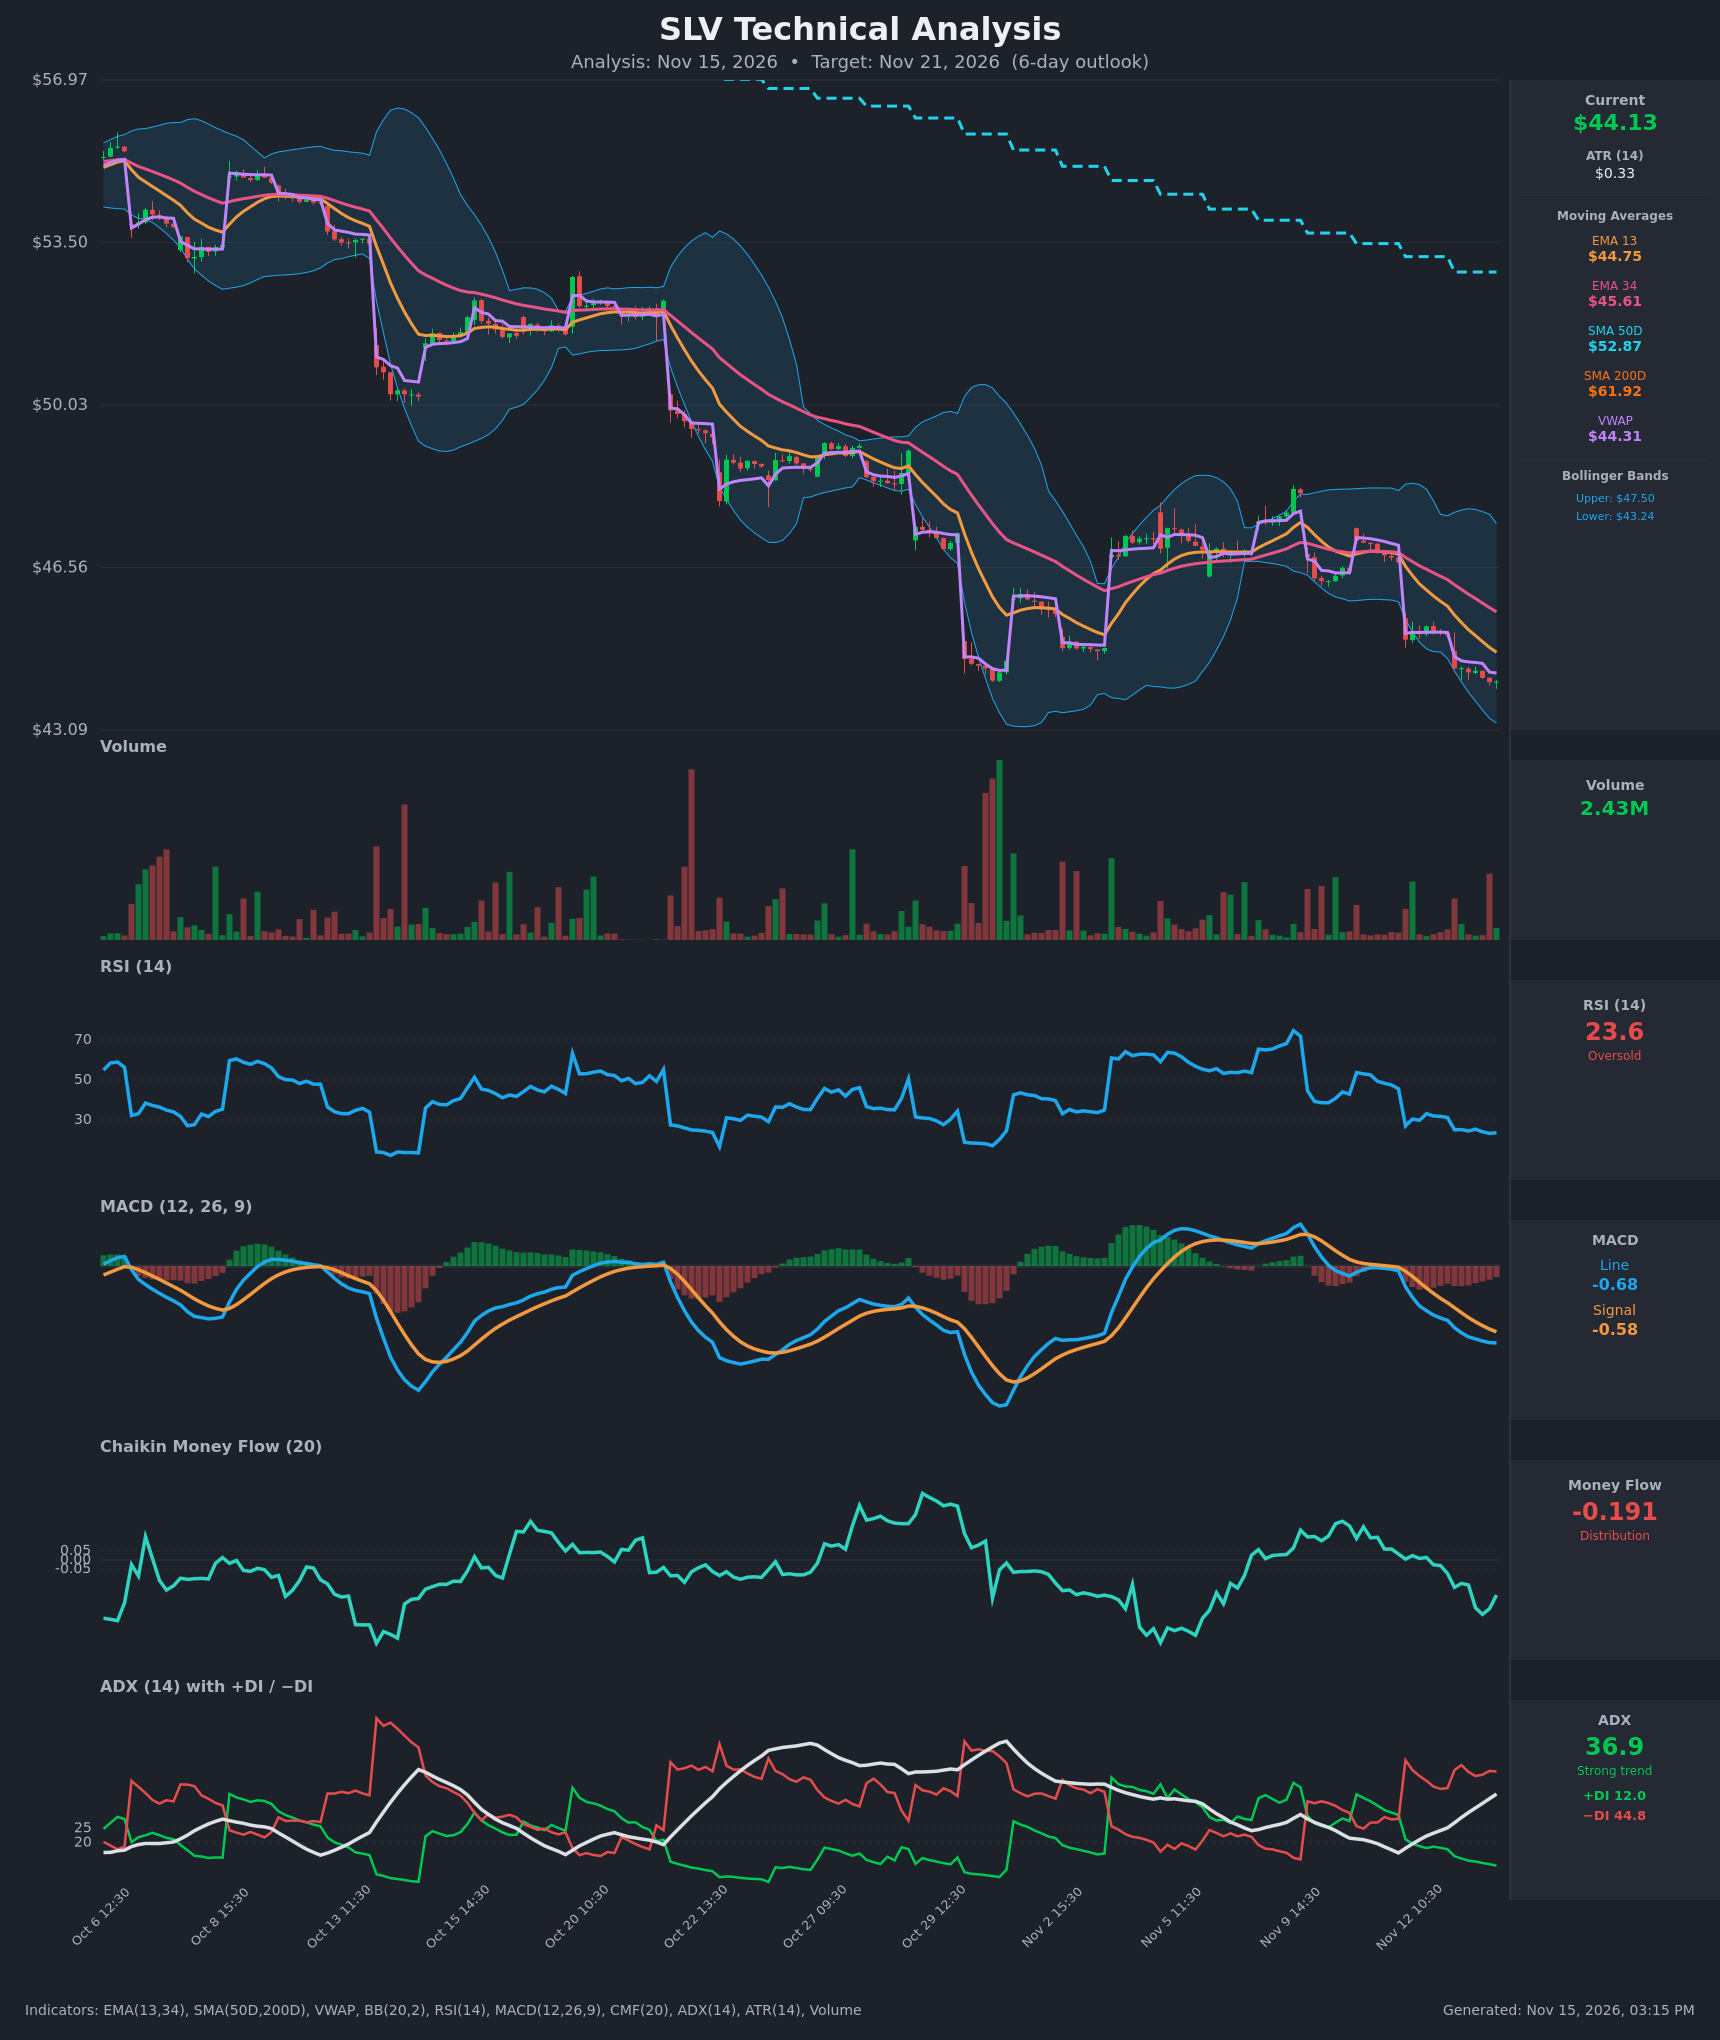
- RSI (14): 23.61, in oversold territory and near the bottom of its recent range. It has trended down from about 45 (Nov 11) to the mid-20s, so momentum is still falling, and there is no bullish divergence yet. Oversold readings can persist in strong trends, but they raise the risk of a sharp relief bounce. [Bearish]
- 20 EMA: The supplied values are EMA 13 at $44.75 and EMA 34 at $45.61. Price at $44.13 is below both. EMA13 is below EMA34 and the gap is widening, so both act as overhead resistance. [Bearish]
- MACD: Line -0.683 is below signal -0.585, giving a histogram of about -0.10. The line crossed below the signal around Nov 12 and the gap keeps widening. Both lines are below zero, which confirms bearish momentum. [Bearish]
- Bollinger Bands (20): Upper $47.50, lower $43.24. Price is in the lower third of the bands and about $0.89 above the lower band. The bands are widening and sloping lower, and price has been walking the lower half. This is a trending-down expansion, not a squeeze. [Bearish]
- CMF (20): -0.191, well below the -0.05 threshold. It fell from about +0.03 on Nov 11 to -0.30 and has ticked up slightly, but selling pressure still dominates. [Distribution]
- ADX (14): 36.9 and rising steadily from 16 to 37 in three sessions. −DI (44.8) is far above +DI (12.0), which describes a strong, accelerating downtrend with bears firmly in control. [Strong Trend – Bearish]
- Volume: 2.43M, moderate. Recent selling bars (Nov 12–13) show steady red volume with no capitulation spike, so the final washout may not have happened. Price is also slightly below VWAP ($44.31). [Mildly Bearish – no capitulation yet]
DIVERGENCES & TRENDS
- No bullish divergence: price is making lower lows and RSI is not diverging in a meaningful way. RSI is lower than at the Nov 5–9 highs but above the early-October extreme near 17.
- Moving-average structure: price is below EMA13, EMA34, SMA50D ($52.87) and SMA200D ($61.92). SMA50D is far below SMA200D, so the death cross is long established. This is a deeply entrenched downtrend.
- MACD: the bearish crossover from the failed Nov 5–9 rally is intact and the histogram is expanding negative.
- ADX and DI: −DI has been above +DI since Nov 12, with ADX crossing above 25 and still rising.
- CMF: it has ticked up slightly from -0.297 to -0.191 on the last bar, an early sign that selling pressure may be fading. That is not yet a reversal.
- Gap-driven decline: the chart shows repeated overnight gap-downs followed by sideways consolidation, which is typical of persistent distribution.
CHART PATTERNS
- Descending channel / Bearish Flag-Pennant continuation: the series of lower highs and lower lows with brief sideways consolidations after each gap down matches the Bearish Flag/Pennant continuation structures. Each consolidation has resolved lower.
- Failed rally: the Nov 5–9 bounce into the upper band (~$47.5) failed, forming a lower high and producing a breakdown. This is consistent with a bearish continuation leg.
- Measured move: the measured downside from the most recent flag is toward $43.00–$43.50, close to the lower Bollinger Band at $43.24.
- Counter-risk: there is no reversal pattern such as a double bottom or inverted head and shoulders yet. A bounce would just be a relief rally within the downtrend.
POTENTIAL SCENARIOS
- Scenario 1: Bearish Trend Continuation — Strong ADX, −DI dominance and distribution keep price pressing lower, with a test of the lower Bollinger Band. Trigger: a break below the recent intraday lows near $44.00 and a hold below VWAP ($44.31). Target: $43.20–$43.60, with an extension to ~$42.60. Invalidation: a close above EMA13 at $44.75. (52% probability)
- Scenario 2: Bullish Oversold Relief Bounce — RSI near 23 and a slight CMF uptick trigger short covering and a mean-reversion bounce toward the EMAs. Trigger: a reclaim of VWAP ($44.31) with rising volume and a MACD histogram contraction. Target: $44.75–$45.20 (EMA13, then the gap area toward EMA34 at $45.61). Invalidation: a new low below $43.24. (36% probability)
- Scenario 3: Neutral Choppy Base — Price consolidates just above the lower band as selling momentum fades. Trigger: low-volume overlapping bars between $43.50 and $44.50. Target: ~$44.00. Invalidation: a decisive break of either $43.24 or $44.75. (12% probability)
PRICE TARGETS
Timeframe: 6 days (range width should be roughly 4–8% of price, so I am using about 5.7%).
- Target Price: $43.60 (about 1.2% below the current $44.13, reflecting bearish continuation tempered by oversold bounce risk)
- Expected Range: $42.45 to $44.95 (width $2.50, about 5.7% of current price)
- Key Levels: Support at $43.24 (lower Bollinger Band), Resistance at $44.75 (EMA13)
OVERALL BIAS
OVERALL BIAS: BEARISH - A strong, accelerating downtrend (ADX 36.9, −DI 44.8 vs +DI 12.0), a bearish MACD crossover, CMF distribution at -0.19, and price below all key moving averages and VWAP outweigh the oversold RSI. Bounce risk toward $44.75 is real, so conviction is modest.
This is educational analysis and not financial advice.