GLD 4-day bullish forecast — Nov 15, 2026
- Bias: Bullish
- Timeframe: 4 days (made Nov 15, 2026, target date Nov 18, 2026)
- Price at analysis: $355.45
- Price target: $358.50
- Expected range: $349.00 – $363.00
- Result: Pending — graded after the close on Nov 18, 2026
Get a free AI analysis of GLD today
Analysis
TECHNICAL INDICATORS
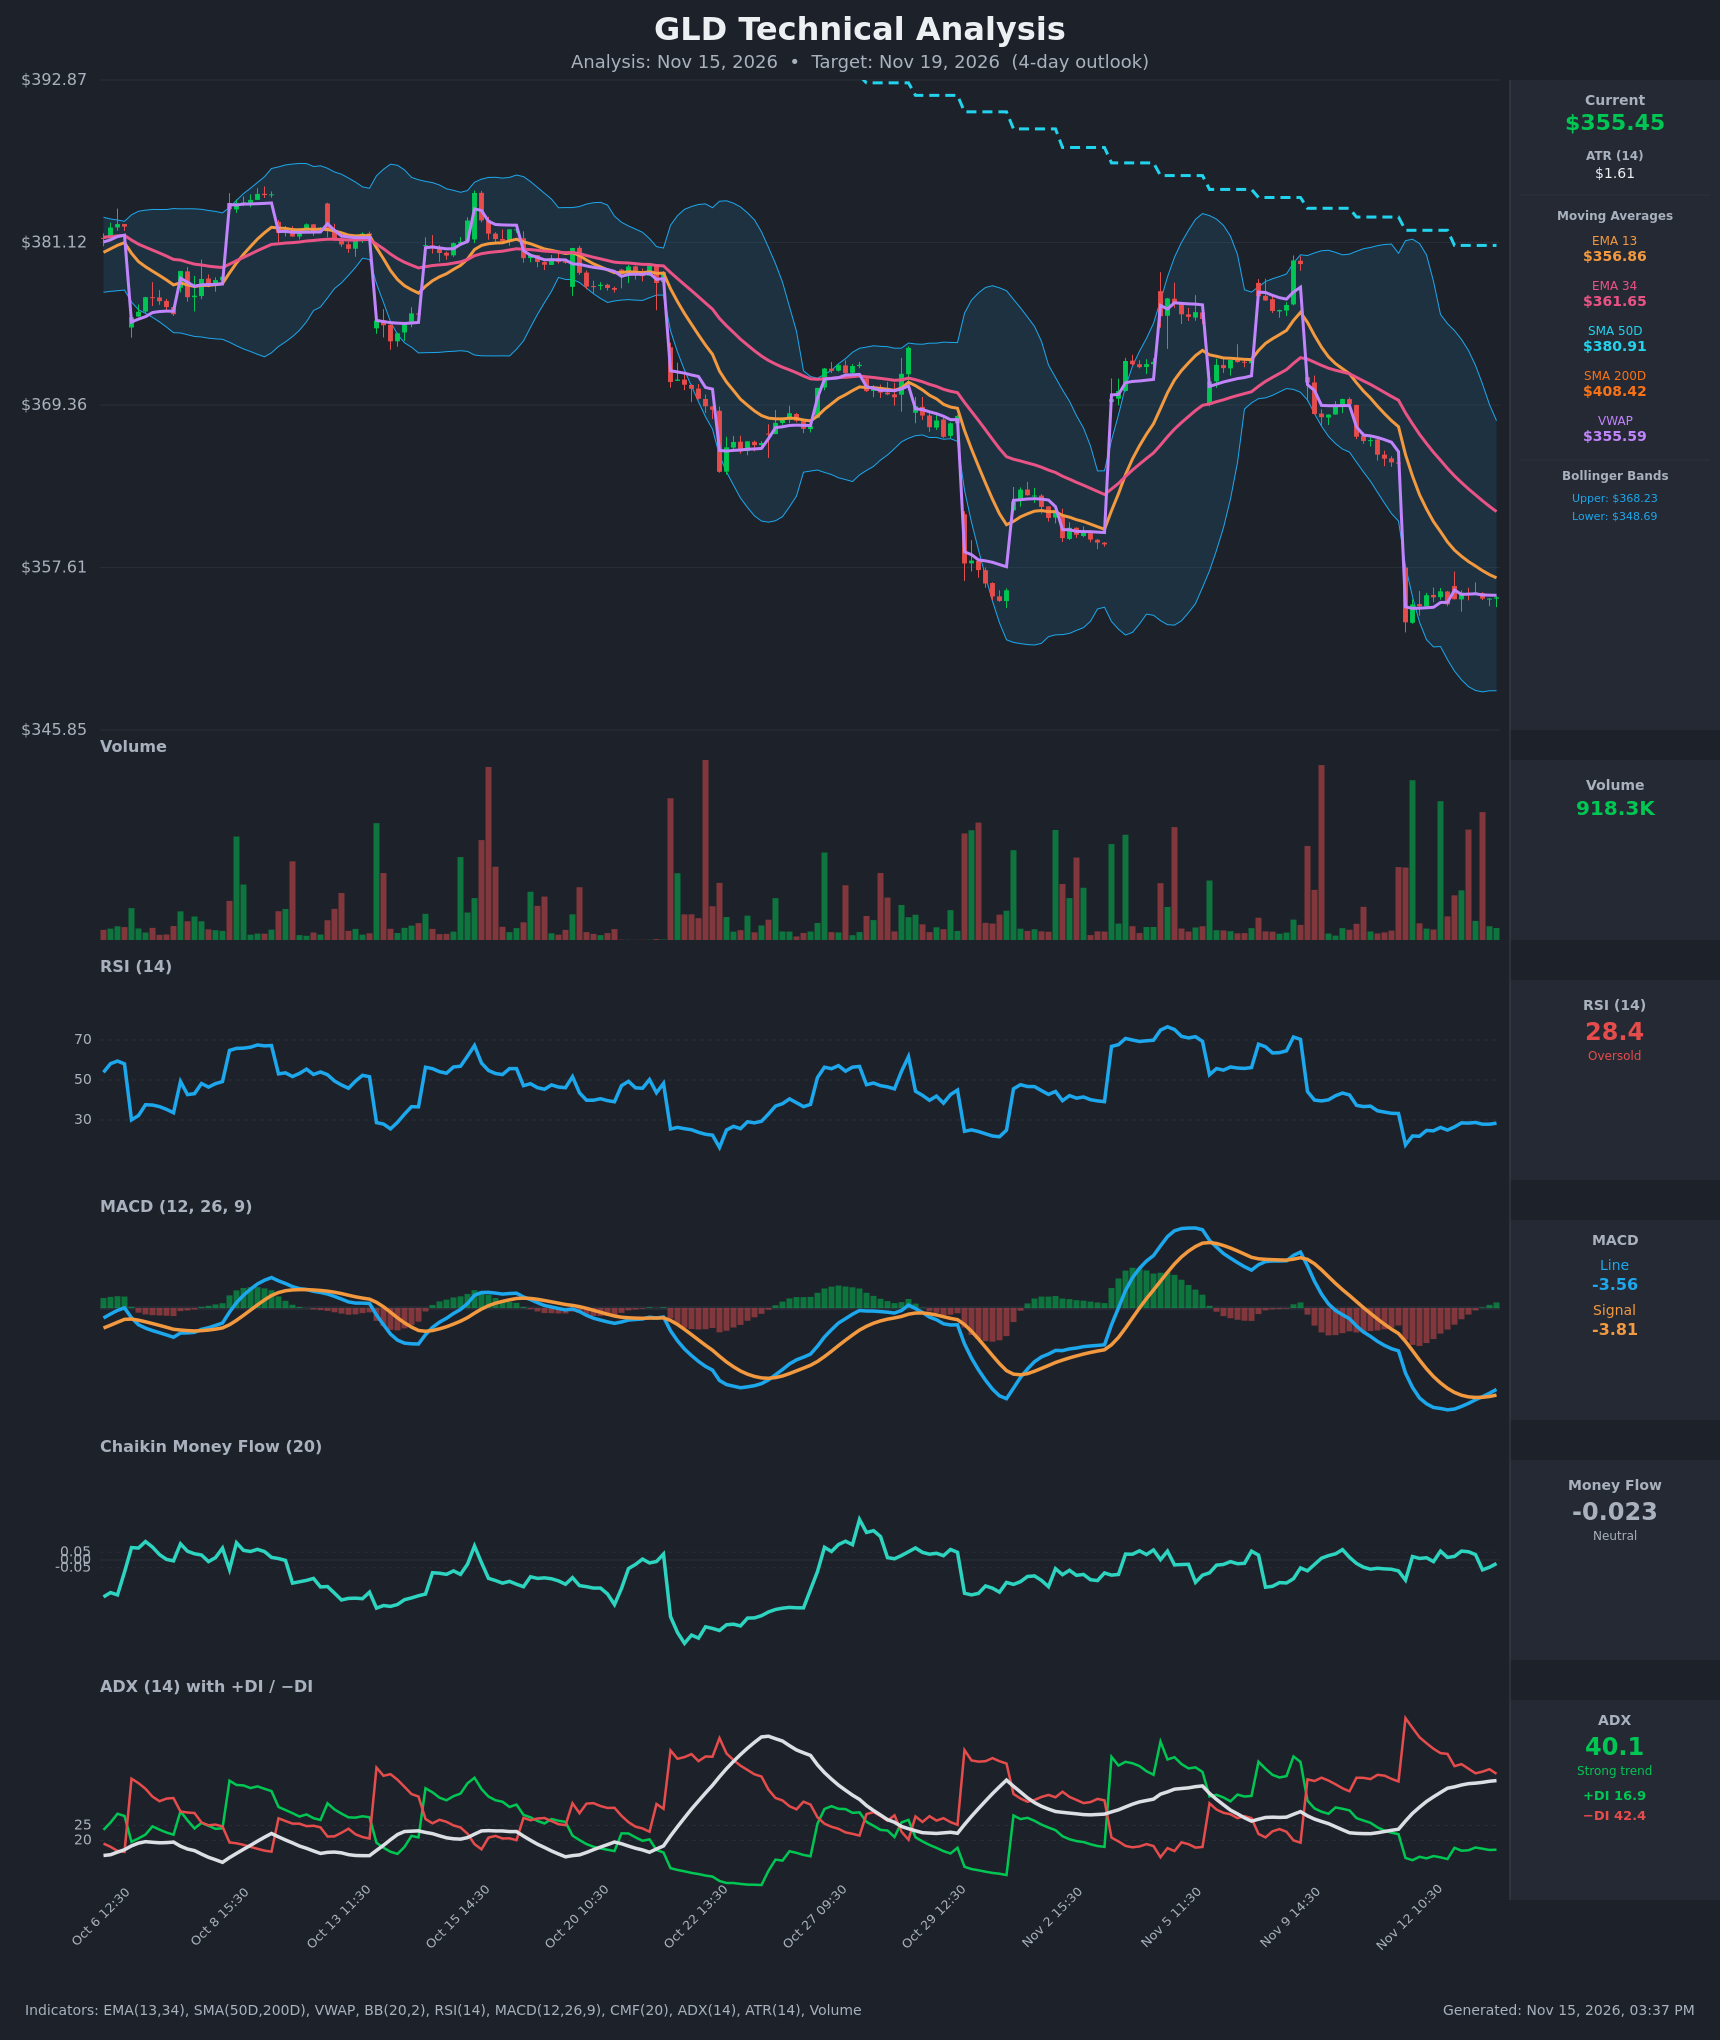
- RSI (14): 28.42 and oversold. It bottomed at 17.6 on Nov 12 and has stayed flat at 25-29 since. It is not making new lows even though price is pinned, which is an early sign of selling exhaustion. [Bullish]
- 20 EMA: The data gives EMA 13 at $356.86 and EMA 34 at $361.65. Price at $355.45 is below both, and EMA 13 is still falling but flattening. EMA 13 is below EMA 34, so the bearish alignment is intact. EMA 13 is the first overhead resistance, only about 0.4% above price. [Bearish]
- MACD: Line -3.558 is above Signal -3.805, a small positive histogram of about +0.25. The bullish crossover occurred around Nov 13 13:30 and the line is rising. Both lines are far below zero, so this is only a relief signal inside a downtrend. [Bullish]
- Bollinger Bands (20): Upper $368.23, lower $348.69, with the bands wide after the selloff. Price at $355.45 sits in the lower half, about 0.35 of the band width above the lower band. It is not riding the lower band any more, so the downside momentum has paused. [Neutral]
- CMF (20): -0.023, between ±0.05, and it has hovered around zero since the gap down. There is no sustained distribution or accumulation. [Neutral]
- ADX (14): 40.1 and rising, with -DI at 42.4 well above +DI at 16.9. This is a strong, mature downtrend with bears in control. An ADX this high after a sharp drop often precedes a pause or a bounce. [Strong Trend – Bearish]
- Volume: 918.3K, with muted volume during the last two days of sideways action compared with the heavy volume on the gap-down. Price at VWAP ($355.59) shows balanced trade. The lack of selling volume suggests the drop is stalling but there is no buyer surge yet. [Neutral – fading selling pressure]
DIVERGENCES & TRENDS
- RSI has held in the high 20s while price made no new lows after Nov 12. This is a mild bullish stabilization signal rather than a true divergence.
- MACD crossed up (line above signal) while price is flat, a tentative bullish momentum shift from deeply negative territory.
- Trend structure is bearish. The 50-day SMA ($380.91) is far below the 200-day ($408.42), a death-cross regime, and price is below every MA.
- The DI spread is wide (−DI 42.4 vs +DI 16.9), but −DI is off its Nov 12 peak of 61, so downside momentum is easing.
- Price is hugging VWAP and EMA 13 is converging toward price. This indicates a mean-reversion bounce setup as long as $353.5 holds.
CHART PATTERNS
- Bearish Pennant / Flag (continuation): Price has consolidated tightly in $354-$356 after a steep gap-down. A downside break targets roughly the flagpole measure, around $348-$349 (the lower Bollinger Band area).
- Bullish Falling Wedge / base (reversal), a less developed alternative: The oversold RSI and the MACD turn-up are consistent with a base. A break above $357-$358 would favor a relief bounce toward EMA 34 ($361.65).
- Earlier oversold gap-down legs in the chart (late October) were followed by sharp rebounds, supporting the mean-reversion case. The larger structure remains a descending channel of lower highs and lower lows.
POTENTIAL SCENARIOS
- Scenario 1: Bullish Oversold Relief Bounce — RSI stabilization and the MACD cross let price reclaim EMA 13 and drift toward the declining EMA 34. Trigger: hourly close above $357.00 (above EMA 13). Target: $358.50-$361.65. Invalidation: close below $353.50. (45% probability)
- Scenario 2: Bearish Flag Breakdown / Trend Continuation — The strong ADX and −DI dominance resume the downtrend after the consolidation. Trigger: break below $353.50 on rising volume. Target: $348.70 (lower Bollinger Band), then $346. Invalidation: close above $358. (40% probability)
- Scenario 3: Neutral Range-Bound Chop — Price stays pinned between $353.50 and $358 around VWAP. Trigger: continued low volume and no break. Target: $354-$357. Invalidation: a decisive break of either boundary. (15% probability)
PRICE TARGETS
- Target Price: $358.50 (4-day horizon, about +0.9%)
- Expected Range: $349.00 to $363.00 (width $14.00, about 3.9% of current price, scaled for a 4-day timeframe)
- Key Levels: Support at $353.50, Resistance at $361.65
OVERALL BIAS
OVERALL BIAS: BULLISH - Oversold RSI that has stopped falling, a MACD bullish crossover, and tight consolidation on fading volume near VWAP favor a modest relief bounce toward EMA 13/EMA 34. The bounce is only slightly favored, because ADX 40 with −DI dominance and the death-cross regime mean a break below $353.50 would resume the downtrend.
This is educational analysis and not financial advice.