QUBT 4-day bearish forecast — Nov 15, 2026
- Bias: Bearish
- Timeframe: 4 days (made Nov 15, 2026, target date Nov 18, 2026)
- Price at analysis: $5.56
- Price target: $5.43
- Expected range: $5.27 – $5.64
- Result: Pending — graded after the close on Nov 18, 2026
Get a free AI analysis of QUBT today
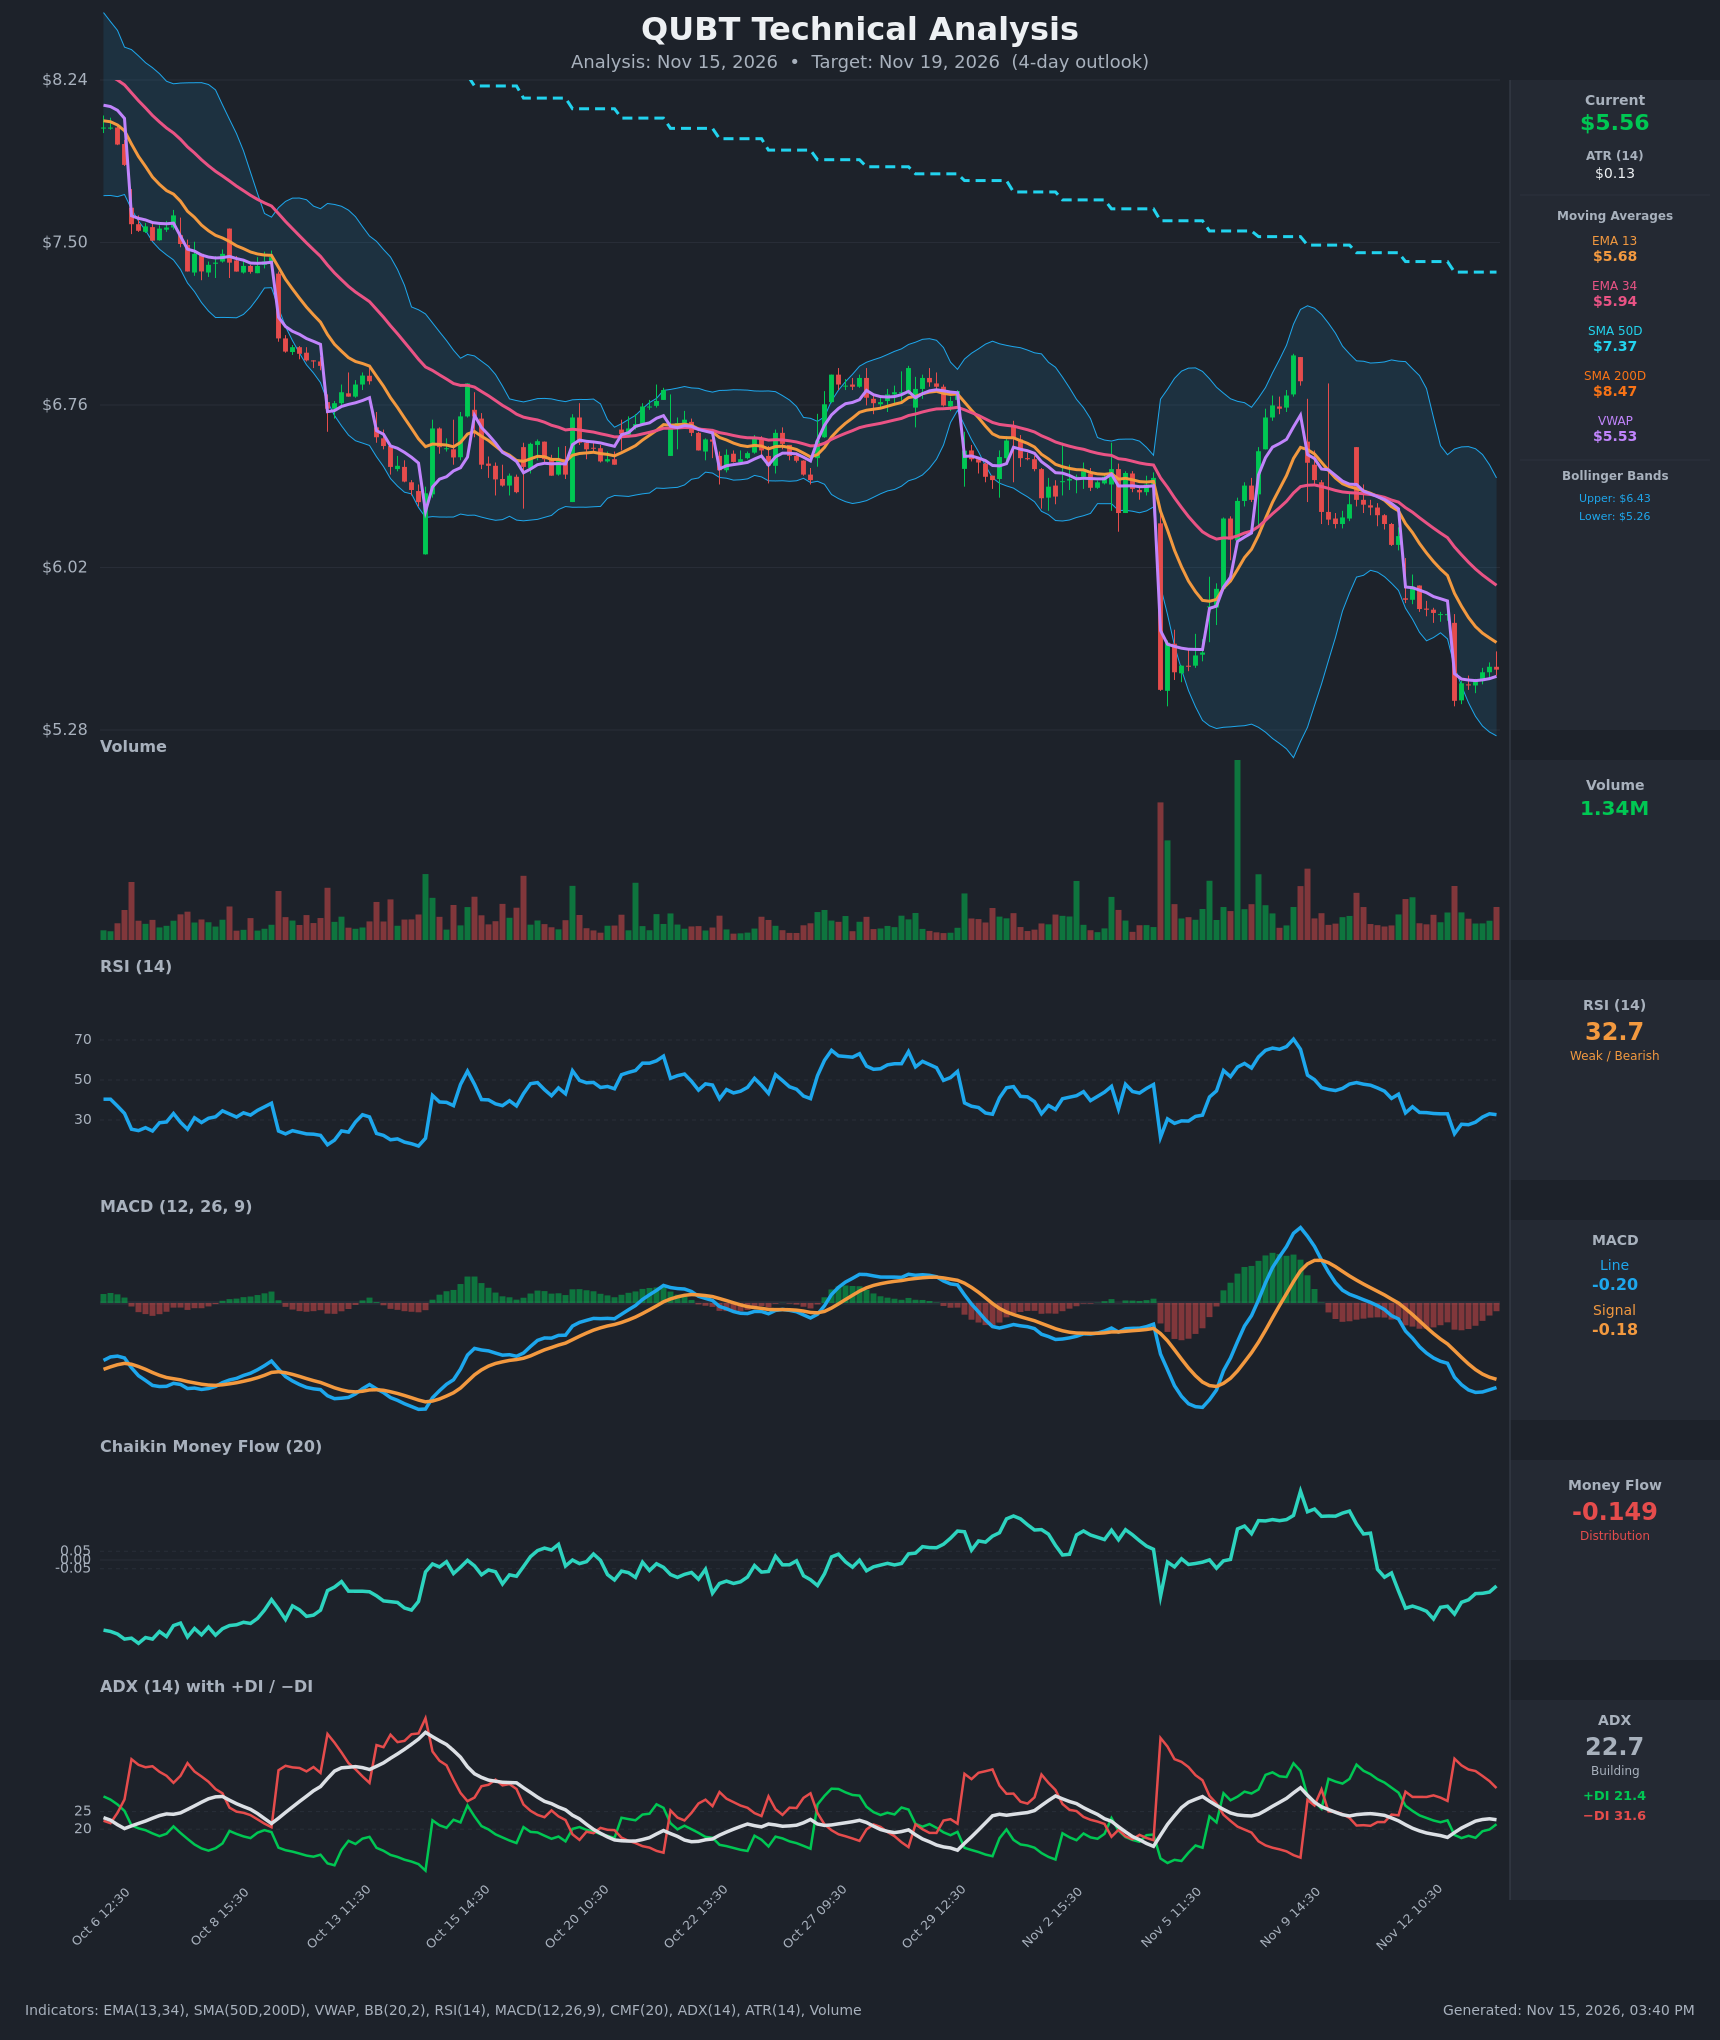
Analysis
TECHNICAL INDICATORS
- RSI (14): 32.66, just above the oversold line. It was 23.2 at the Nov 13 open and has bounced to the low 30s. Momentum is weak but stabilizing, with no bullish centerline reclaim. [Bearish]
- 20 EMA: The data gives EMA 13 at $5.68 and EMA 34 at $5.94. Price at $5.557 is below both, and EMA13 is below EMA34 with a widening gap. Both slope down and act as overhead resistance. [Bearish]
- MACD: Line -0.203, signal -0.183, so the line is below the signal. The histogram is about -0.02, down from about -0.065 on Nov 13. The negative histogram is narrowing, so selling momentum is fading, but there is no bullish crossover. [Bearish]
- Bollinger Bands (20): Upper $6.43, lower $5.26, with price in the lower third of the bands. The bands are wide after the volatile gap-down and are starting to roll over. Price is hugging the lower half but is not yet at the lower band. That leaves room for a push toward $5.26, though a bounce toward the midline is also possible. [Bearish]
- CMF (20): -0.149, well below -0.05. It was near -0.34 on Nov 12 and has improved to -0.149, but it is still clearly negative, which means distribution. [Distribution]
- ADX (14): 22.7 and building, up from 17.7 on Nov 12. −DI at 31.6 is above +DI at 21.4. The trend is moderate and strengthening, and the bears are in control. [Moderate Trend, Bearish]
- Volume: 1.34M, ordinary relative to the recent bars. The heaviest volume came on the red gap-down bars, and the bounce is on light volume. That points to a weak relief move rather than real buying. [Mildly Bearish]
DIVERGENCES & TRENDS
- Price is making lower lows while RSI and MACD are also at or near lows, so there is no clear bullish divergence. The RSI low of 23 on Nov 13 was deeper than earlier lows near 25, which suggests a washout rather than a divergence.
- The MACD histogram is shrinking, and CMF has ticked up from -0.31 to -0.15. Both hint at fading downside momentum and a possible short-term relief bounce.
- The death cross is in place, with SMA50D ($7.37) below SMA200D ($8.47). Price sits about 34% below the SMA200D, a persistent long-term downtrend.
- EMA13 is below EMA34, and the gap widened from about 0.04 on Nov 11 to about 0.26 now, confirming bearish trend structure.
- −DI has been above +DI since Nov 12. ADX is rising from below 20, a sign that the downtrend is re-accelerating.
- Price is slightly above VWAP ($5.5265), so intraday buyers are defending the area, but this is a minor positive.
- MACD remains below its signal with no bullish cross. The lower highs in the MACD line since early November confirm that the Nov 9 bounce has failed.
CHART PATTERNS
- Bearish Flag / Pennant (continuation): After the sharp drop from about $5.81 to $5.42 on Nov 13, price has drifted sideways to slightly higher in a small range around $5.49–$5.57, a tight consolidation under falling EMAs. A break below about $5.42–$5.45 targets a measured move of the roughly $0.39 pole, which implies about $5.05.
- Bearish Rising Wedge (minor, hourly): The recent higher lows and higher highs from $5.42 are small and on light volume, consistent with a corrective bounce inside the downtrend.
- Larger structure: The decline from $8.2 to $5.5 shows lower highs and lower lows. The failed rally to about $7.0 on Nov 9 is a lower high. This is a descending/bearish continuation structure with no reversal pattern such as a double bottom confirmed yet.
- Reversal risk: A Bullish Falling Wedge is not confirmed, so it is not an active signal. The oversold RSI and lower Bollinger Band proximity raise the chance of a bounce, but the pattern evidence favors continuation.
POTENTIAL SCENARIOS
- Scenario 1: Bearish Flag Breakdown — The tight consolidation above $5.42 fails and the downtrend continues, with price drifting toward the lower Bollinger Band. Trigger: hourly close below $5.42, with −DI staying above 30 and CMF staying negative. Target: $5.26–$5.30, with an extension toward $5.05 if volume expands. Invalidation: hourly close above $5.70 (EMA13). (52% probability)
- Scenario 2: Bullish Oversold Relief Bounce — The RSI is in the low 30s after a washout, the MACD histogram is narrowing, and price holds above VWAP, so a rebound toward the falling EMAs is possible. Trigger: close above $5.68 with a MACD bullish cross and improving CMF. Target: $5.90–$5.95 (EMA34). Invalidation: close back below $5.42. (28% probability)
- Scenario 3: Neutral Range Chop — Price consolidates between $5.40 and $5.68 as ADX stays near 22 and momentum equalizes. Trigger: failed breaks on both sides. Target: $5.50–$5.62. Invalidation: close outside the $5.40–$5.68 range. (20% probability)
PRICE TARGETS
- Target Price: $5.43 (4-day horizon)
- Expected Range: $5.27 to $5.64 (width $0.37, about 6.7% of current price, sized for a 4-day window)
- Key Levels: Support at $5.40, Resistance at $5.68
OVERALL BIAS
OVERALL BIAS: BEARISH - Price is below all key moving averages, the death cross is in place, −DI dominates +DI with ADX rising, MACD is below its signal, and CMF shows distribution. The oversold RSI and narrowing MACD histogram limit the downside, so I expect a modest drift lower rather than a collapse.
This is educational analysis and not financial advice.