ARM 4-day bearish forecast — Nov 15, 2026
- Bias: Bearish
- Timeframe: 4 days (made Nov 15, 2026, target date Nov 18, 2026)
- Price at analysis: $190.42
- Price target: $187.60
- Expected range: $183.00 – $193.00
- Result: Pending — graded after the close on Nov 18, 2026
Get a free AI analysis of ARM today
Analysis
TECHNICAL INDICATORS
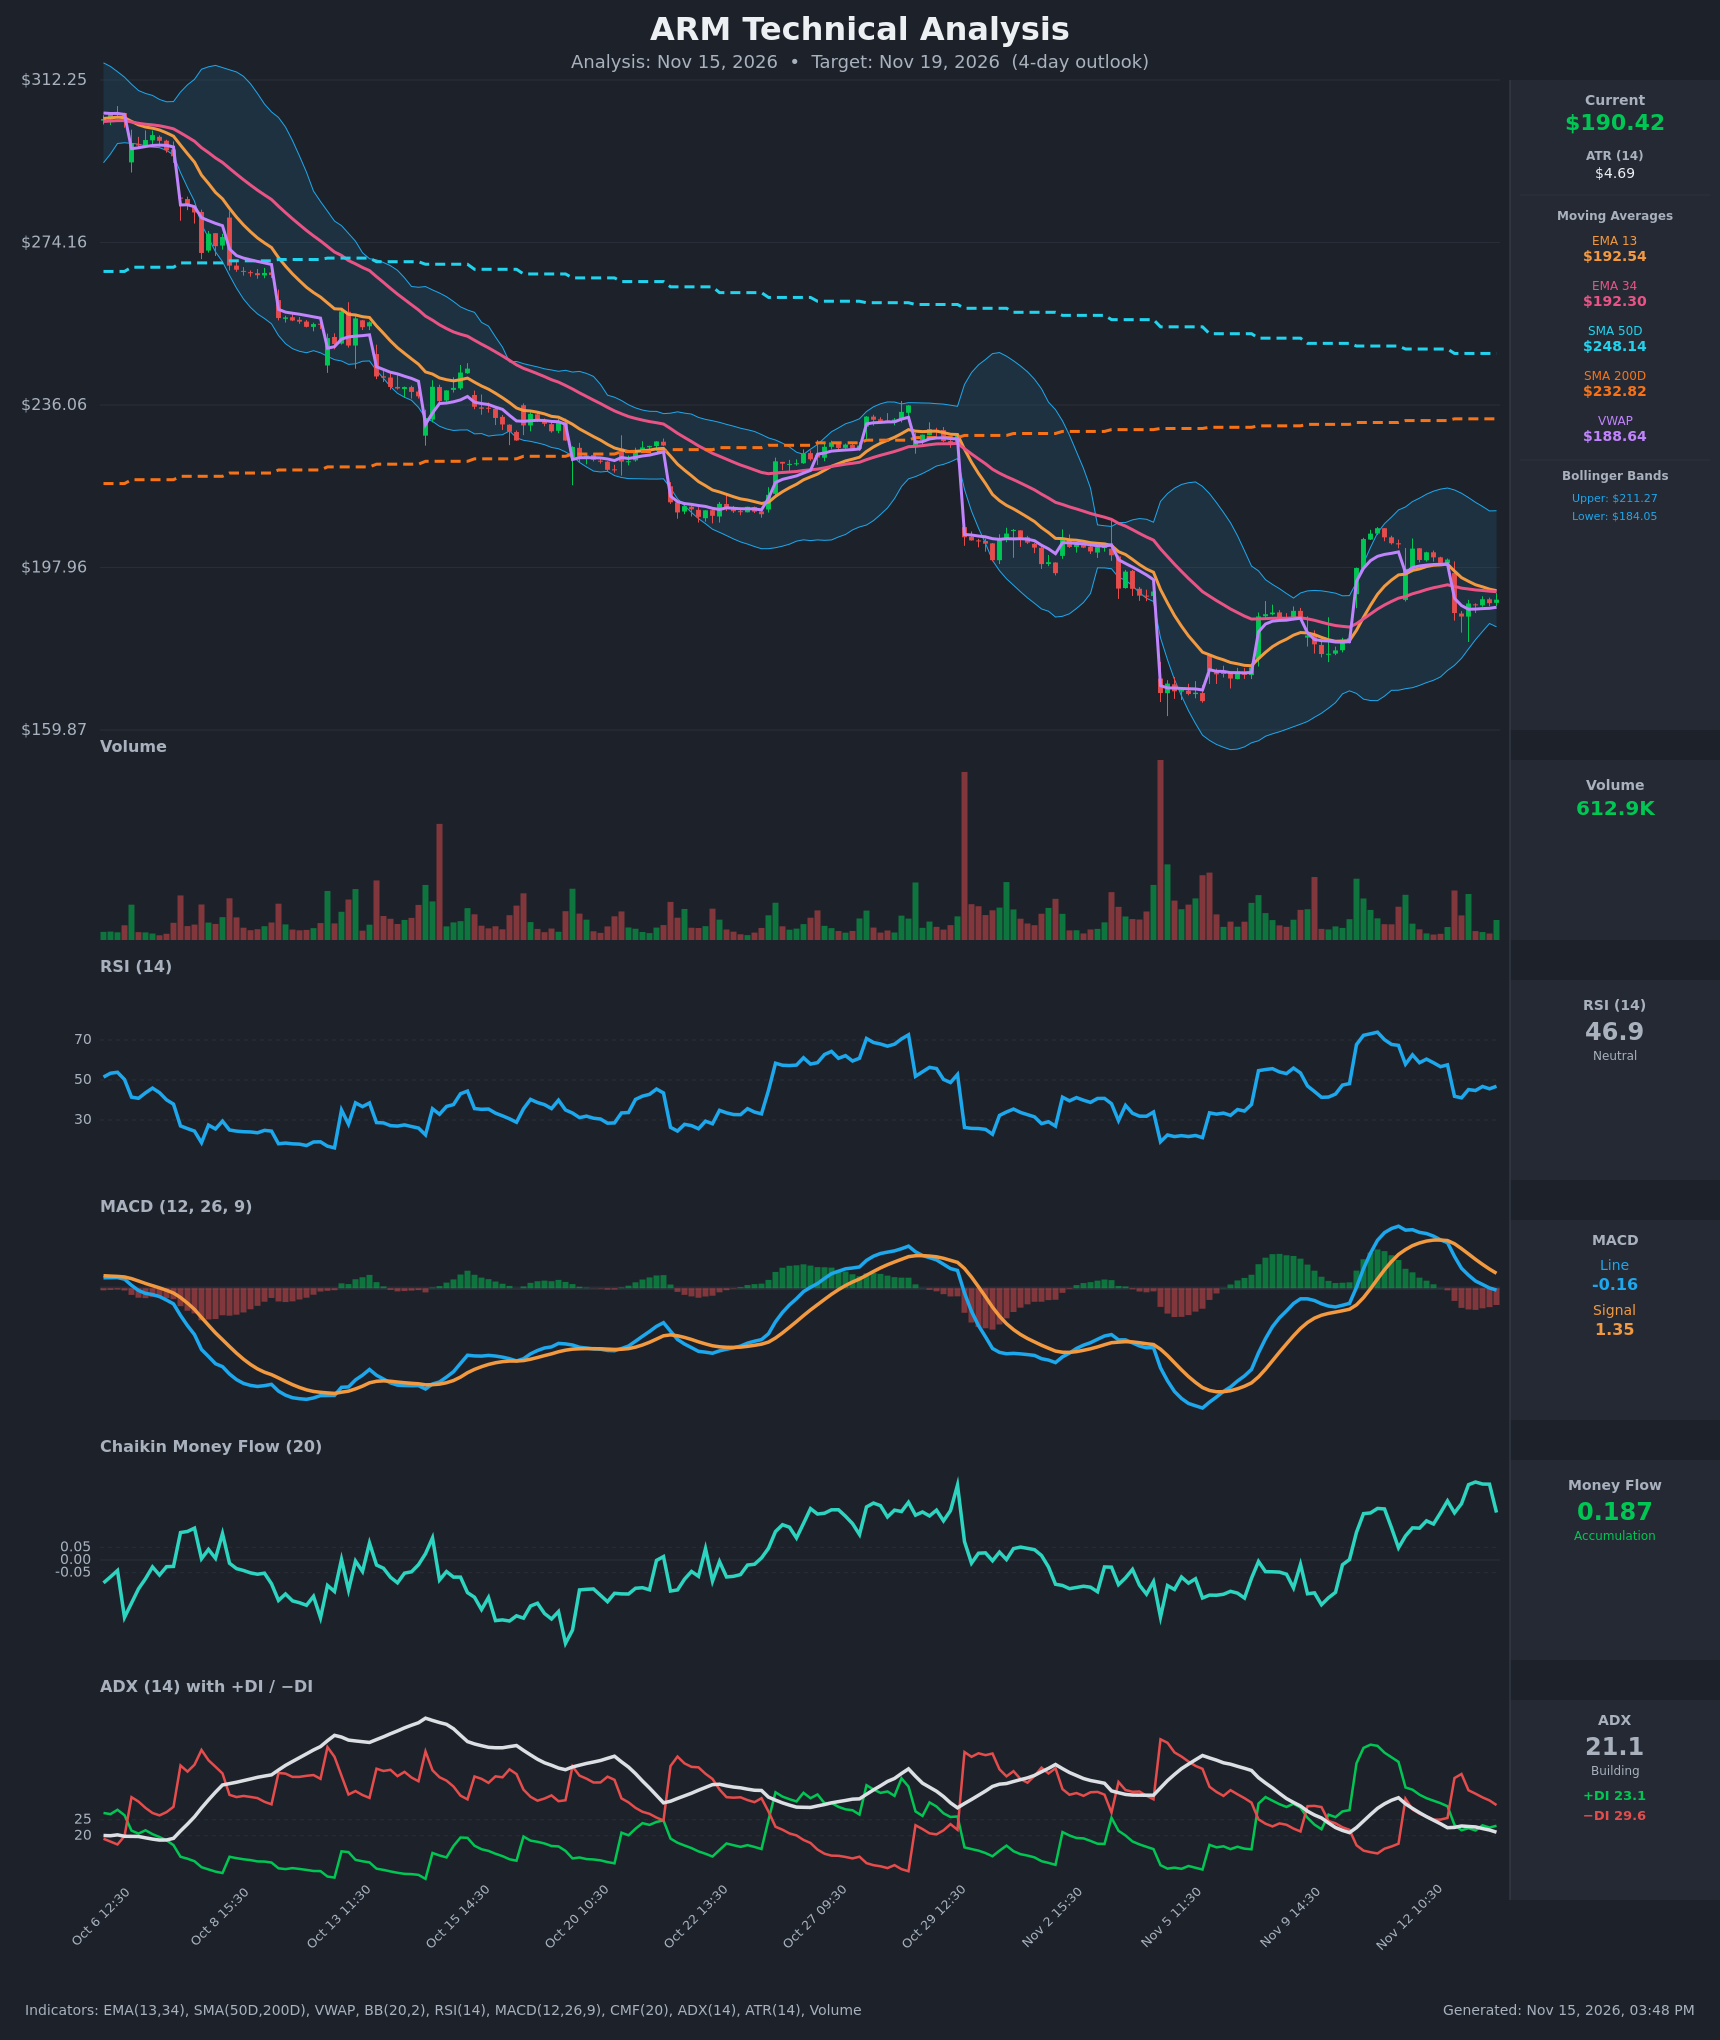
- RSI (14): 46.85, just under the 50 midline. It has fallen from about 73 in early November and from 58 on Nov 12 to the low 40s after the Nov 13 gap down. It has recovered only modestly, so momentum is neutral with a slight downward lean. [Neutral]
- 20 EMA (EMA 13/34 used): EMA 13 is $192.54 and EMA 34 is $192.30. Price at $190.42 is below both, so they act as overhead resistance. EMA 13 has dropped from $198.75 and is nearly touching EMA 34, so a bearish EMA crossover is imminent. [Bearish]
- MACD: The line is -0.16 and the signal is +1.35. The line crossed below the signal on Nov 12 at 14:30 and has slipped below zero. The histogram is negative and widening. [Bearish]
- Bollinger Bands (20): Upper $211.27, lower $184.05, so price is sitting slightly below the midline (about $197.7). The bands are wide after the Nov 13 gap, so volatility is elevated. Price has room to drift toward the lower band without being oversold. [Neutral]
- CMF (20): 0.187, well above +0.05 and the highest in the recent range. It indicates buying pressure and accumulation, but it dipped from 0.308 on the last bar. It is a notable bullish offset to the price weakness. [Accumulation]
- ADX (14): 21.1, which is weak and borderline range-bound. −DI (29.6) is above +DI (23.1), so bears hold the edge, but the trend is not strong. The Nov 13 DI flip happened on the gap down. [Weak Trend, Bearish lean]
- Volume: 612.9K on the latest bar, which is light. The sell-off bars (gap down) carried larger volume than the sideways drift since. Declining volume in the consolidation suggests a lack of conviction on both sides. [Neutral / mildly bearish]
Other levels:
- VWAP: $188.64, just below price. It is the nearest support and a short-term pivot.
- SMA 50/200: Price is far below SMA50 ($248.14) and SMA200 ($232.82). That marks a long-term downtrend, and SMA50 is falling toward SMA200, so a death cross is a pending risk.
DIVERGENCES & TRENDS
- CMF vs. price: CMF is rising strongly (about 0.19–0.30) while price makes lower highs and trades sideways to lower. This is a bullish divergence that could support a bounce, but it has not yet been confirmed by price or MACD.
- MACD: It has been in a bearish crossover since Nov 12 and is now below zero, with a deepening negative histogram.
- RSI: It made a lower high relative to the earlier peak near 73, with no bullish divergence on the recent low.
- EMAs: EMA 13 is rolling over and converging on EMA 34. A bearish cross is likely within the next few bars.
- DI: −DI crossed above +DI on the Nov 13 gap and has stayed there. ADX near 21 shows the trend is not strongly directional.
- Higher timeframe: The sequence of lower highs and lower lows since early October is intact, with a bounce from about $165 to about $205 that has now failed.
CHART PATTERNS
- Bearish Flag / Pennant (continuation): After the sharp gap down from about $200 to $187, price has been consolidating in a narrow $186–$191 band. This resembles a bearish flag or pennant within the larger downtrend. A break below roughly $186 targets the flag-pole measured move toward the lower Bollinger Band area near $184 and then lower.
- Lower high within a larger downtrend: The recent $205 peak is well below the prior highs, which supports the continuation thesis.
- Counter-pattern: If the sideways box resolves up on strong CMF support, price could retest EMA 13/34 near $192.5 and the $198–$200 area. This is not a confirmed reversal pattern.
POTENTIAL SCENARIOS
- Scenario 1: Bearish Flag Breakdown — The EMA 13/34 bearish cross completes, the negative MACD histogram persists, and price loses VWAP, drifting toward the lower Bollinger Band. Trigger: a close below $188.60 (VWAP) and then $186. Target: $184.00–$185.00. Invalidation: a close above $193 (above both EMAs). (50% probability)
- Scenario 2: Neutral Range Chop — Price stays in the $186–$192 consolidation as ADX stays under 25 and the CMF and DI signals offset each other. Trigger: repeated rejection near $192.5 and support at VWAP. Target: $188–$191. Invalidation: a break outside $185–$193. (20% probability)
- Scenario 3: Bullish CMF-Led Bounce — Accumulation (CMF 0.19) pushes price back through the EMAs, forcing a short-term squeeze. Trigger: a close above $192.55 with rising volume. Target: $196–$198. Invalidation: a fall back below $188.60. (30% probability)
PRICE TARGETS
- Target Price: $187.60 (4-day horizon, about -1.5%)
- Expected Range: $183.00 to $193.00 (width $10.00, about 5.3% of current price, which fits the ~4–6% guidance for a 4-day window)
- Key Levels: Support at $184.05 (lower Bollinger Band; VWAP at $188.64 is the nearer pivot), Resistance at $192.54 (EMA 13, with EMA 34 at $192.30)
OVERALL BIAS
OVERALL BIAS: BEARISH - Price is below its falling EMAs and well below SMA50/200, MACD has crossed bearish, and −DI leads +DI. A bearish flag is forming in the larger downtrend. The strong CMF reading limits conviction, so the expected downside is modest, toward the $184–$188 area.
This is educational analysis and not financial advice.