ARM 6-day bearish forecast — Nov 15, 2026
- Bias: Bearish
- Timeframe: 6 days (made Nov 15, 2026, target date Nov 20, 2026)
- Price at analysis: $190.42
- Price target: $186.50
- Expected range: $183.50 – $196.00
- Result: Pending — graded after the close on Nov 20, 2026
Get a free AI analysis of ARM today
Analysis
TECHNICAL INDICATORS
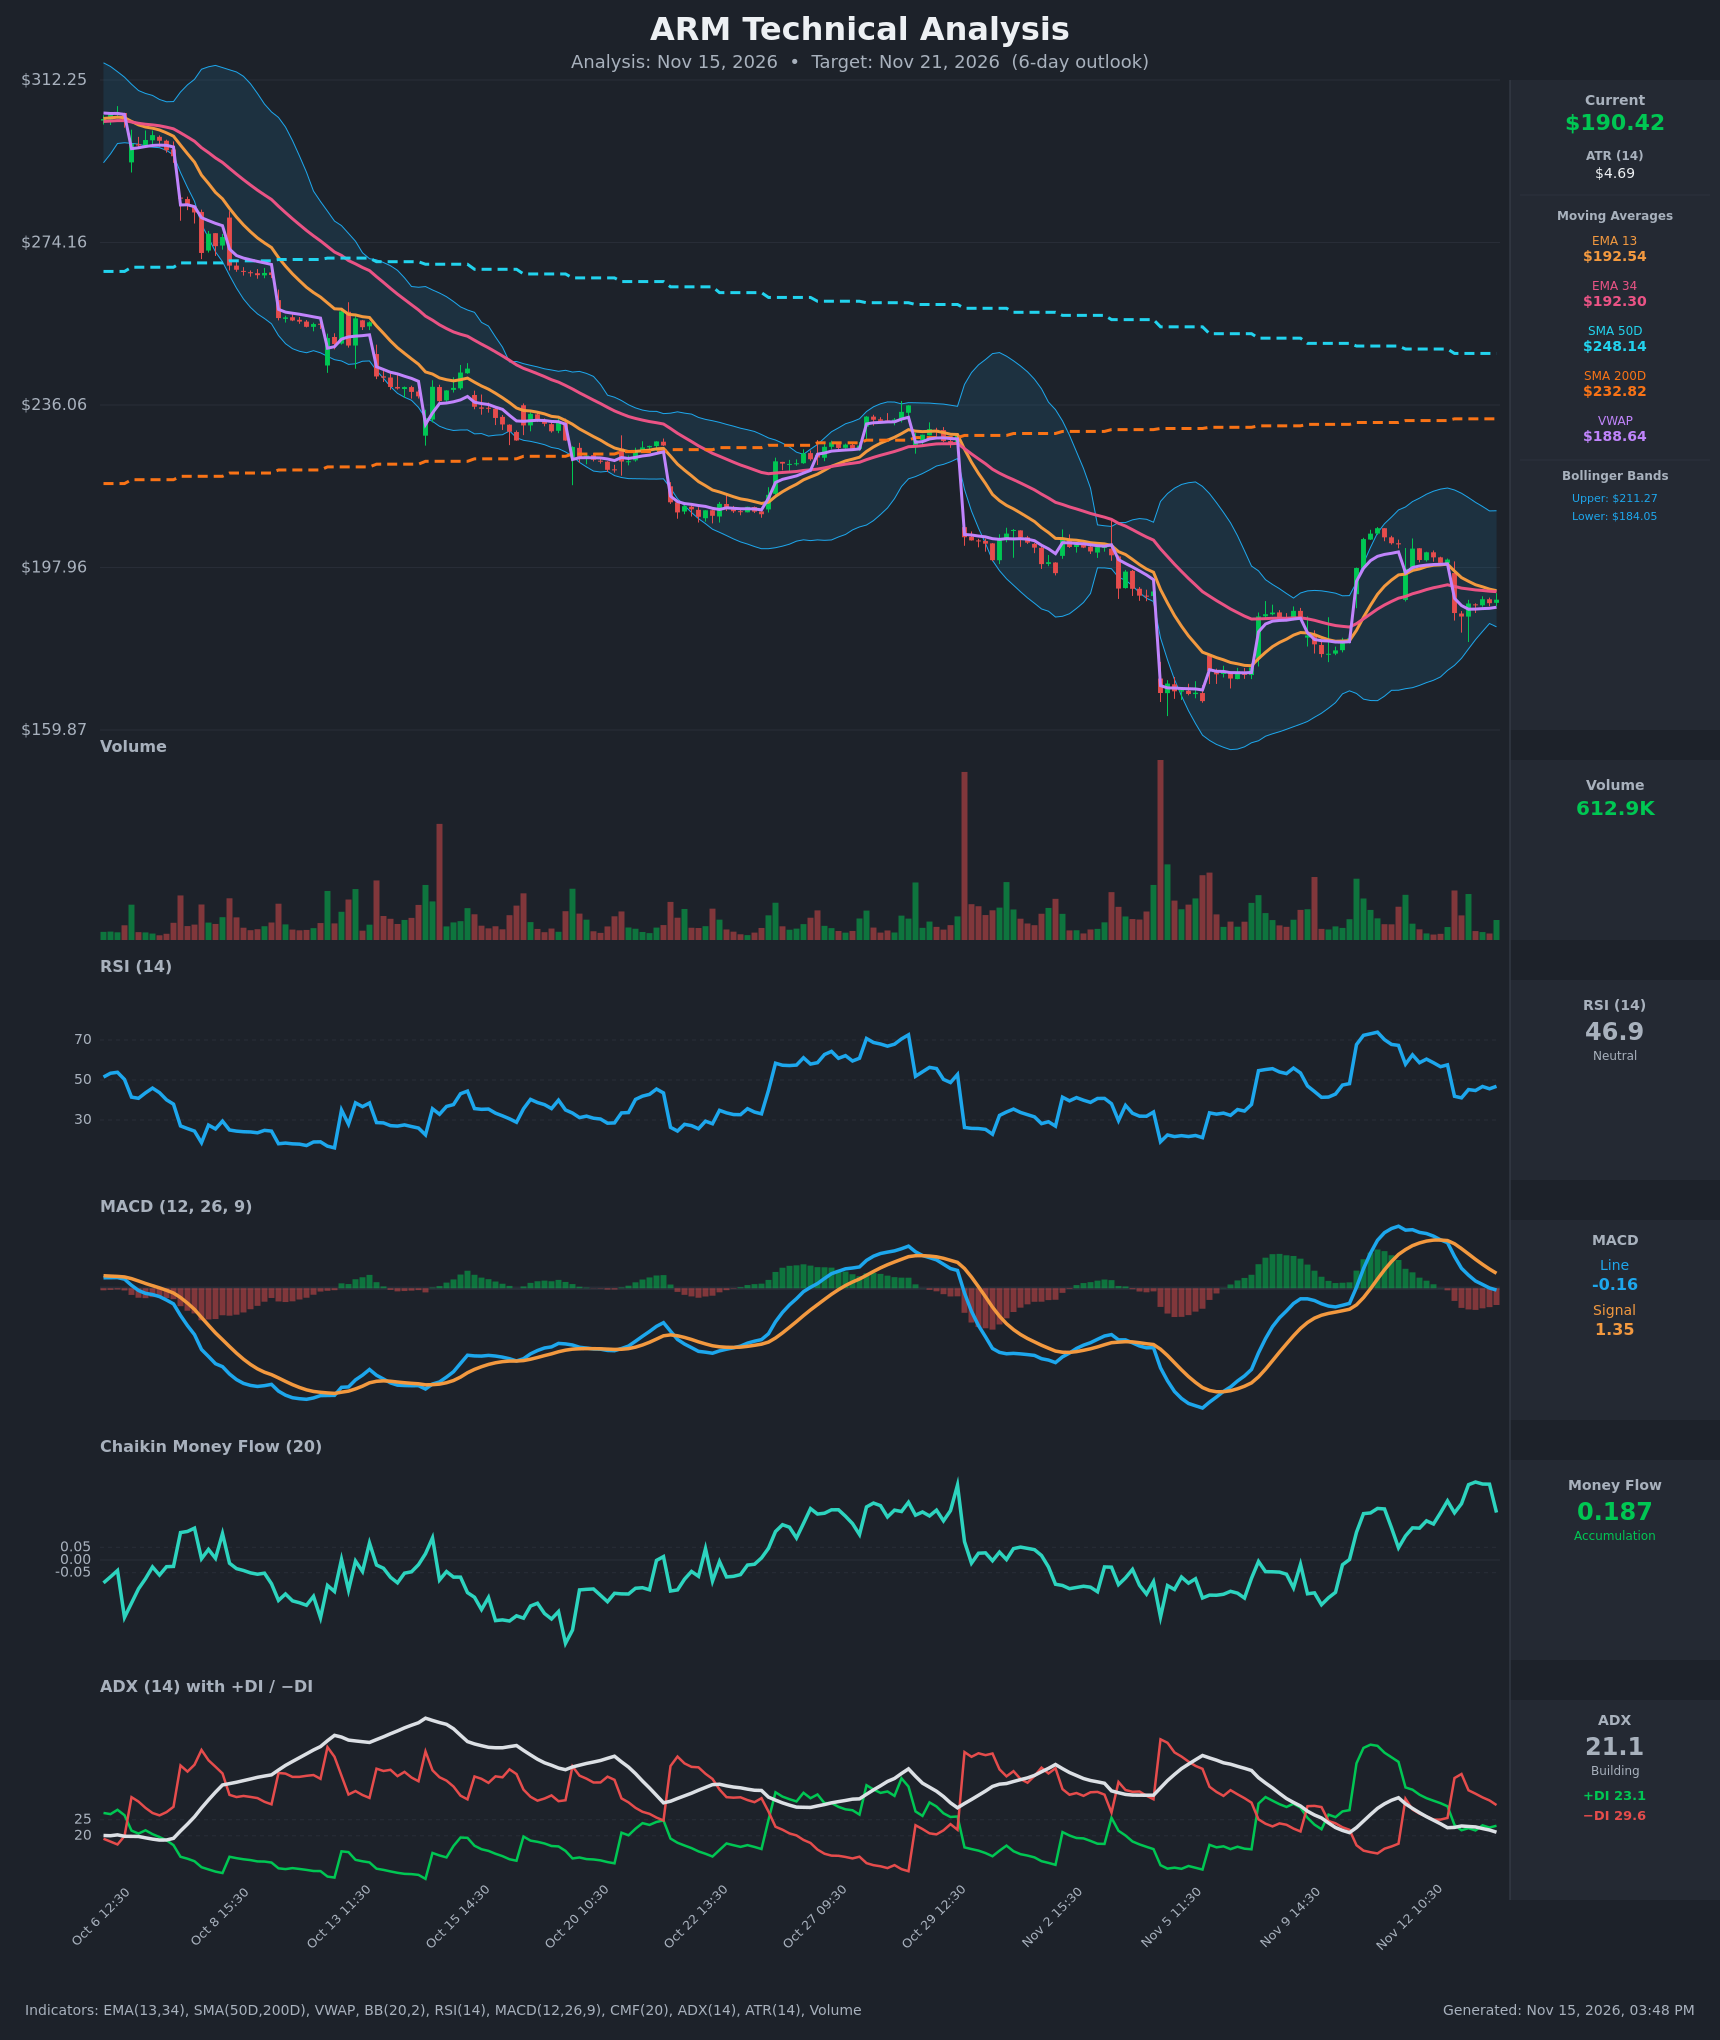
- RSI (14): 46.85. It fell from about 58 to 41 on the Nov 13 gap-down and has since recovered only to the mid-40s. That is neutral-to-slightly-weak momentum, below 50 with no oversold bounce signal. [Neutral]
- 20 EMA (EMA 13 / EMA 34 provided): EMA13 is $192.54 and EMA34 is $192.30. Price at $190.42 sits just below both, so they act as overhead resistance. EMA13 has rolled over from $198.75 and is about to cross below EMA34, a bearish crossover in progress. [Bearish]
- MACD: The line is -0.16 against a signal of 1.35. The line crossed below the signal around Nov 12-13 and has dipped below zero. The histogram is negative and still expanding, so bearish momentum is building. [Bearish]
- Bollinger Bands (20): Upper $211.27, lower $184.05, midline about $197.66. Price is in the lower half of the bands, about $6.4 above the lower band and $7 below the midline. The bands are wide after the recent volatility. Failure to reclaim the midline is a bearish tell, while a hold above the lower band keeps a range intact. [Bearish]
- CMF (20): 0.187, well above +0.05, and it has been positive and rising through the gap-down. That means closes are landing in the upper part of each bar's range and buyers are absorbing the selling. It is the strongest bullish counter-signal, though it ticked down from 0.308. [Accumulation]
- ADX (14): 21.1 and falling, with -DI (29.6) above +DI (23.1). Trend strength is weak and borderline range-bound, but bears hold directional control. A DI crossover reversal has not occurred. [Weak Trend, Bearish lean]
- Volume: 612.9K, light on the latest bar and well below the spike volume on the earlier gap-down days. The post-gap consolidation is happening on fading volume, so there is no capitulation or strong conviction either way. [Neutral / Low conviction]
DIVERGENCES & TRENDS
- Long-term trend: Price ($190.42) is far below SMA200D ($232.82) and SMA50D ($248.14), and SMA50D is well above SMA200D. This is a severe downtrend. The last major low was near $160 in early November, followed by a bounce to about $210. The gap-down on Nov 13 erased much of that bounce.
- Crossovers:
- MACD has crossed bearish.
- EMA13 is converging on EMA34 and about to cross below it.
- -DI crossed back above +DI on Nov 13.
- VWAP: Price at $190.42 is slightly above VWAP at $188.64. This is a mild positive, showing intraday buyers defending the post-gap lows.
- Divergence: CMF is high and positive while price is falling and MACD is rolling over. This is a mild bullish divergence, with accumulation hinting that the $186-187 area is being defended. It has not yet been confirmed by price, since price remains below the EMAs.
- Trend in indicators: MACD histogram is deepening, ADX is declining (a fading trend, which supports consolidation), and RSI is stuck below 50.
CHART PATTERNS
- Bearish Flag / Pennant (continuation): After the sharp gap-down from about $200 to $187, price has traded in a tight $186.5–$190.5 range under the falling EMAs. This resembles the Bearish Flag/Pennant pattern in the reference diagram. A breakdown below about $186.4 projects toward $180 or lower. The measured move from the gap is roughly $13, though over 6 days I expect only a partial move.
- Broader context: The lower highs since the early-November bounce, with the Nov 11-12 peak near $203-210 failing under the SMA200D, fit a bear-market rally within the larger downtrend. Overhead resistance includes the EMAs at about $192.3–$192.5 and the gap fill near $197–$200.
- Alternative: If price holds $186.5 and CMF stays elevated, a small Bullish Double Bottom could form. It would need a reclaim of $192.5 to activate, and that has not happened.
POTENTIAL SCENARIOS
- Scenario 1: Bearish Flag Breakdown — Price fails to reclaim the EMA cluster, MACD stays negative, and -DI stays dominant. Sellers push through the post-gap low. Trigger: hourly close below $186.40 on rising volume. Target: $184.00 (lower Bollinger Band), extending to $181-182. Invalidation: close above $193 (EMA cluster reclaimed). (50% probability)
- Scenario 2: Neutral Range Consolidation — Price chops inside the post-gap box on fading volume and weak ADX. Trigger: continued holds above $186.5 and rejections near $192-193. Target: $187–$192. Invalidation: close outside $184 or $194. (25% probability)
- Scenario 3: Bullish Relief Bounce — CMF accumulation and the VWAP hold fuel a squeeze back to the gap-fill zone. Trigger: close above $192.55 with MACD histogram stabilizing. Target: $197.50 (Bollinger midline). Invalidation: loss of $186.40. (25% probability)
PRICE TARGETS
- Target Price: $186.50 (6 days)
- Expected Range: $183.50 to $196.00 (width $12.50, about 6.6% of current price, consistent with the 6-day guidance of roughly 4-8%)
- Key Levels: Support at $186.47 (post-gap low), Resistance at $192.54 (EMA13 / EMA34 cluster)
OVERALL BIAS
OVERALL BIAS: BEARISH - Price is below the rolling-over EMAs and far below SMA50D and SMA200D. MACD has crossed bearish with an expanding negative histogram, and -DI leads +DI. The post-gap consolidation resembles a bearish flag, and elevated CMF and the VWAP hold temper conviction, so expect a modest downside drift rather than a collapse.
This is educational analysis and not financial advice.