IREN 34-day bearish forecast — Nov 15, 2026
- Bias: Bearish
- Timeframe: 34 days (made Nov 15, 2026, target date Dec 18, 2026)
- Price at analysis: $18.17
- Price target: $16.50
- Expected range: $14.80 – $18.00
- Result: Pending — graded after the close on Dec 18, 2026
Get a free AI analysis of IREN today
Analysis
TECHNICAL INDICATORS
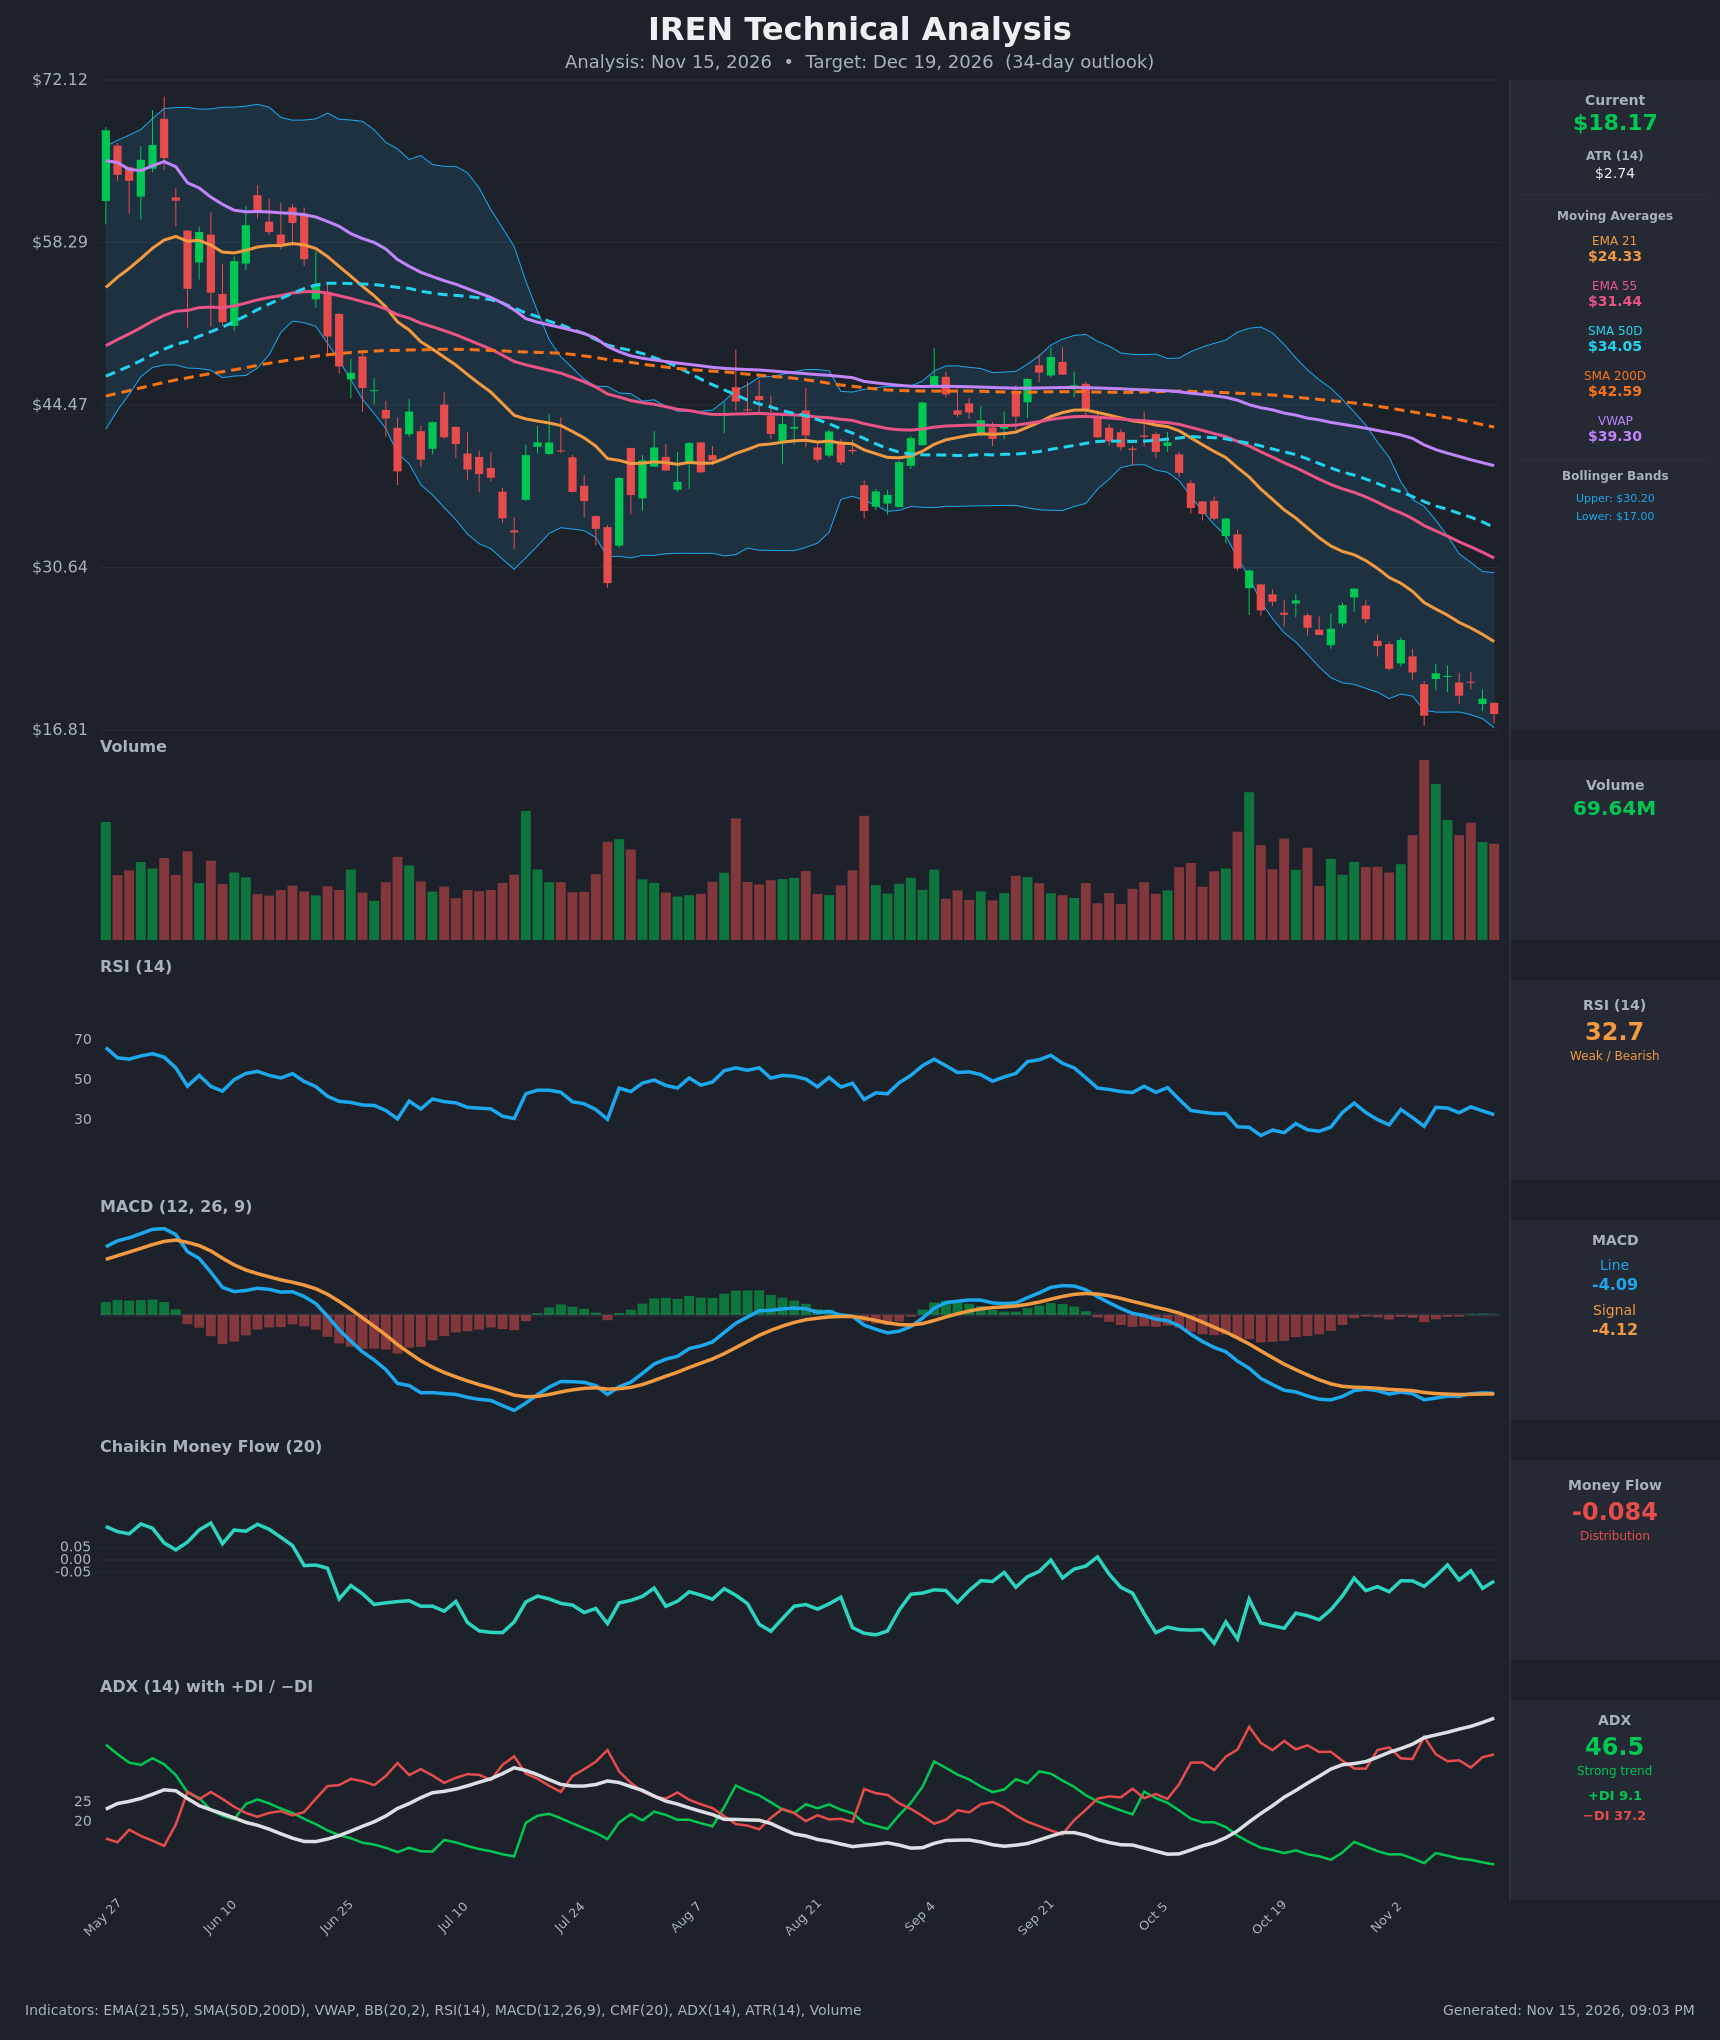
- RSI (14): 32.70, just above the oversold line. It has stayed in a 26-37 band for three weeks, with bounces failing at 36-38. Price retested the Nov 5 low ($18.03, RSI 26.8) at $18.17 with RSI 32.7, a mild bullish divergence. Momentum is still weak and has not confirmed a turn. [Bearish]
- 20 EMA: The chart uses an EMA 21 at $24.33, and price is about 25% below it. EMA 21 ($24.33) is below EMA 55 ($31.44), and both are falling steeply. The EMA is acting as dynamic resistance, and every rally since Oct has stalled well below it. [Bearish]
- MACD: Line -4.091 vs signal -4.120, histogram about +0.03. The line crossed marginally above the signal around Nov 11, but both sit deep in negative territory and have flattened. This is a weak, low-conviction sign that downside momentum is stabilizing, not a real bullish crossover. [Neutral]
- Bollinger Bands (20): Upper $30.20, lower $17.00. Price at $18.17 is hugging the lower band, with the bands still expanding downward. In a strong trend this is "walking the band" (continuation) rather than a reversal signal. The mid-band (~$23.6) is a likely mean-reversion target if a bounce comes. [Bearish]
- CMF (20): -0.084, below the -0.05 threshold. It has improved from -0.198 on Oct 26 but is still in distribution. Selling pressure is easing, not reversed. [Distribution]
- ADX (14): 46.5 and rising, with −DI (37.2) far above +DI (9.1). This is a very strong, mature downtrend with bears firmly in control. ADX above 45 can signal trend exhaustion, but there is no DI crossover to suggest a change. [Strong Trend – Bearish]
- Volume: 69.64M, well above the earlier-year average. Heavy volume has accompanied the breakdown since early Oct, with spikes on red candles, which confirms active distribution. The latest bounce attempts came on lighter volume. There is no clear capitulation reversal bar yet. [Bearish – confirms selling]
DIVERGENCES & TRENDS
- Mild bullish RSI divergence: price made an equal or slightly lower low ($18.03 → $18.17 close) while RSI rose from 26.8 to 32.7. CMF has also been trending up from -0.198 to -0.084. This hints at selling fatigue, but it is not confirmed by a break of the lower-high structure.
- Death cross: SMA50D ($34.05) is already below SMA200D ($42.59), and EMA21 is below EMA55. The long-term trend is firmly down, and price is far below SMA200D and VWAP ($39.30).
- MACD/signal convergence: a barely positive histogram after weeks of negative readings is a tentative stabilization, but not a trend change.
- DI structure: −DI has been above +DI throughout, with no bullish DI cross. ADX has risen steadily from about 33 to 46.5.
- Lower highs and lower lows: closes have stepped down from $28.84 (Oct 28) to $26 → $24 → $21.6 → $20.8 → $18.17.
CHART PATTERNS
- Descending Triangle (bearish continuation): since Nov 5, price has formed lower highs ($21.64 → $21.41 → $20.84 → $19.48) against a flat support zone near $18.0-18.2, which has been tested twice. A breakdown below ~$18 would project a measured move of about $3.6 (the triangle height from $21.6 to $18), pointing to roughly $14.5-15.
- Larger context: a long-term Descending Channel / Bearish Rising Wedge-style sequence of lower highs from the $70 area, all consistent with a continuation downtrend.
- Counter-pattern (low probability): the repeated $18 test could form a Bullish Double Bottom, but it needs a close above ~$21.6 (the neckline/lower-high) to confirm. That has not happened.
POTENTIAL SCENARIOS
- Scenario 1: Bearish Descending Triangle Breakdown — Support at ~$18 gives way on high volume. ADX above 45 and −DI dominance favor trend continuation, and there are no overhead supports until old structure far below. Trigger: daily close below $17.00 (lower BB / $16.81 chart low). Target: $15.00-$16.50, with an extension to ~$14.50. Invalidation: daily close above $21.60. (50% probability)
- Scenario 2: Bullish Oversold Relief Bounce — The RSI divergence, improving CMF, and a price 25% below the EMA 21 fuel a mean-reversion rally. Trigger: close above $20.84 on rising volume, with MACD histogram expanding. Target: $22-$24 (EMA 21 at ~$24.3, mid-band ~$23.6). Invalidation: close below $17.00. (33% probability)
- Scenario 3: Neutral Basing Range — Price chops between $17 and $21 as selling exhausts but buyers lack conviction. Trigger: failed breakdown and failed bounce, with ADX rolling over. Target: $17.50-$20.50. Invalidation: close outside $16.80-$21.60. (17% probability)
PRICE TARGETS
- Target Price: $16.50 (34-day horizon, Dec 19, 2026)
- Expected Range: $14.80 to $18.00 (width $3.20, about 17.6% of current price, consistent with the 30-60 day guidance of 12-18%)
- Key Levels: Support at $17.00 (lower Bollinger Band, near the $16.81 chart low), Resistance at $21.60 (Nov 6 closing high / lower-high trend)
OVERALL BIAS
OVERALL BIAS: BEARISH - ADX of 46.5 with −DI at 37.2 vs +DI at 9.1, price below every moving average, a death cross already in place, and CMF still in distribution all favor continuation. A descending triangle with flat support near $18 gives a measured downside of ~$14.5-15. Bounce risk is real given the RSI divergence and improving CMF, which is why the target is moderate at $16.50.
This is educational analysis and not financial advice.