ARM 13-day bearish forecast — Nov 15, 2026
- Bias: Bearish
- Timeframe: 13 days (made Nov 15, 2026, target date Nov 27, 2026)
- Price at analysis: $190.42
- Price target: $186.00
- Expected range: $177.00 – $195.00
- Result: Pending — graded after the close on Nov 27, 2026
Get a free AI analysis of ARM today
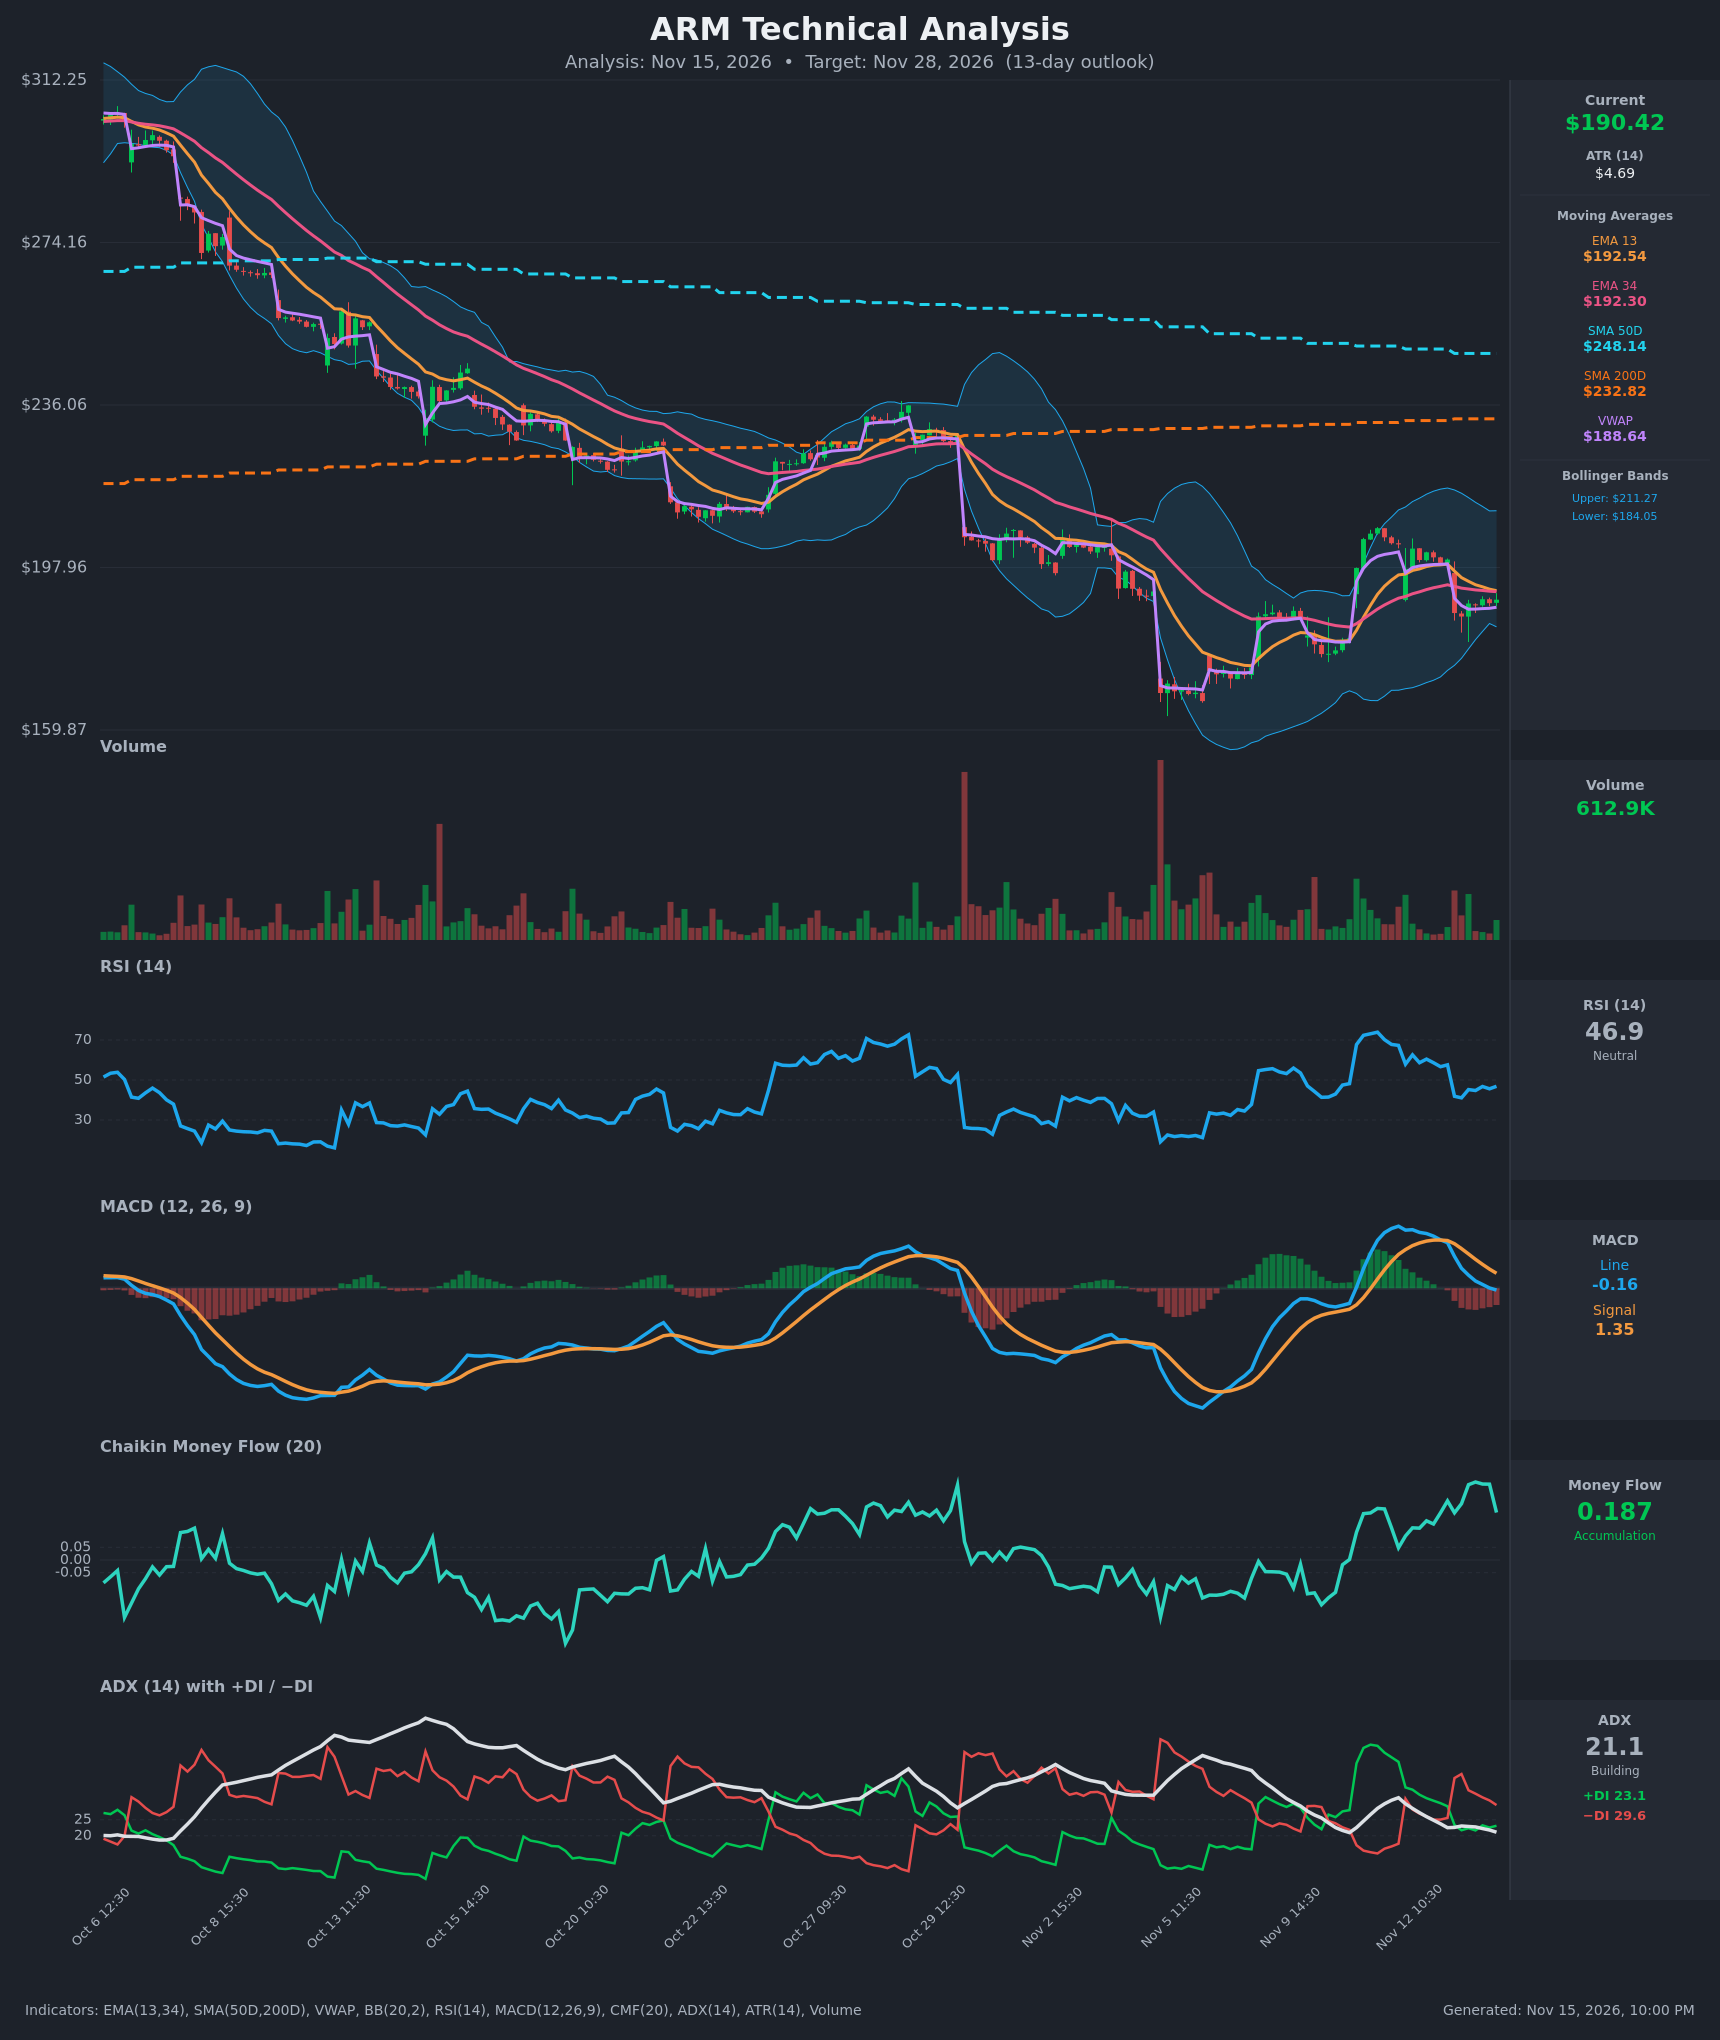
Analysis
TECHNICAL INDICATORS
- RSI (14): 46.85, slipping from the low-70s peak around Nov 11 (67.3) and through the 50 midline. Momentum is fading but not oversold. [Neutral]
- 20 EMA: The chart shows EMA 13 at $192.54 and EMA 34 at $192.30. Price at $190.42 sits just below both, so they act as overhead resistance. The EMA13 has flattened sharply toward the EMA34 and is on the verge of a bearish cross. [Bearish]
- MACD: Line -0.16 is below signal 1.35. It crossed down around Nov 12-13 and the histogram is negative and widening, which points to fading upside momentum. [Bearish]
- Bollinger Bands (20): Upper $211.27, lower $184.05, midline about $197.66. Price is in the lower half of the bands, about $6 above the lower band, and the bands are moderately wide. The failure to hold the midline after the Nov 12 push favors a drift toward the lower band. [Bearish]
- CMF (20): 0.187, well above +0.05 and positive for several sessions. It dipped from 0.308 but still shows accumulation, which is the main bullish counterweight. [Accumulation]
- ADX (14): 21.1, borderline and falling from 31.8. −DI (29.6) is above +DI (23.1), so bears have the edge, but the trend is weak. [Weak Trend, Bearish lean]
- Volume: 612.9K, light on the latest bar. The heavy-volume sessions are the large selloff days (e.g. the Nov 5-6 flush and the Oct 29 gap), while the bounce came on modest volume. That makes the rally less convincing. [Neutral to Bearish]
Price is also above VWAP ($188.64) by a small margin, a modest support. It is far below SMA200 ($232.82) and SMA50 ($248.14), which confirms the long-term downtrend. SMA50 is still above SMA200, so there is no death cross yet, but the gap is widening.
DIVERGENCES & TRENDS
- Higher low in price vs. prior low: The Nov 6 low (~$165) was followed by a rally to ~$207, showing a tentative base.
- CMF vs. price/MACD: CMF is near its highs while price and MACD roll over. This is a bullish divergence in money flow, but it has not yet produced price confirmation.
- MACD: A bearish signal-line cross with a deepening negative histogram.
- DI crossover: −DI retook control from +DI on Nov 13 as price gapped down from ~$200 to ~$187. ADX has fallen below 25, which signals a weak, choppy trend rather than a fresh impulse.
- EMA 13/34: Nearly converged. A bearish cross is likely if price stays below $192.
- Larger trend: Lower highs since October (~$300 to ~$207) and price below both SMAs.
CHART PATTERNS
- Bearish flag / pennant (continuation): After the Nov 6 low, the rally and tight consolidation resemble a bounce inside a larger downtrend. A breakdown below ~$184 projects toward ~$175 and the prior ~$165 low.
- Rectangle range ($165-$207): Price has oscillated in a wide band since early November. The latest lower high at ~$203-207 and failure at the BB midline favor the lower half of the range.
- Double-bottom attempt (bullish reversal, unconfirmed): The ~$165 area, supported by strong CMF, would be confirmed only by a close above ~$207. That is unlikely within 13 days.
POTENTIAL SCENARIOS
- Scenario 1: Bearish Pullback to Lower Band — Price stays capped under the 13/34 EMA cluster, the MACD and DI bearish signals persist, and price tests the lower Bollinger Band. Trigger: rejection at $192.5 and a close below $188.6 (VWAP). Target: $184 first, then $177. Invalidation: daily close above $198. (50% probability)
- Scenario 2: Bullish Accumulation Rebound — Strong CMF accumulation leads to a reclaim of the EMAs and a push to the BB midline and above. Trigger: close above $192.5 with rising volume and a MACD turn. Target: $198 then $205. Invalidation: close below $184. (35% probability)
- Scenario 3: Neutral Range Chop — Price oscillates between $184 and $193 as ADX stays weak. Trigger: failure of both the $184 and $193 levels to break. Target: $188-$192. Invalidation: a decisive close outside $183-$198. (15% probability)
PRICE TARGETS
- Target Price: $186.00 (13-day)
- Expected Range: $177.00 to $195.00 (width $18, about 9.5% of current price, consistent with a 13-day window)
- Key Levels: Support at $184.05 (lower Bollinger Band), Resistance at $192.54 (EMA 13; secondary at about $197.66, the BB midline)
OVERALL BIAS
OVERALL BIAS: BEARISH - Price is below the 13/34 EMAs, with a bearish MACD cross, −DI above +DI, and a long-term downtrend below both SMAs. Strong CMF accumulation and the VWAP hold temper conviction, so the expected drift is modest, toward the $184 lower band.
This is educational analysis and not financial advice.