GLD 13-day bullish forecast — Nov 15, 2026
- Bias: Bullish
- Timeframe: 13 days (made Nov 15, 2026, target date Nov 27, 2026)
- Price at analysis: $355.45
- Price target: $361.50
- Expected range: $345.00 – $372.00
- Result: Pending — graded after the close on Nov 27, 2026
Get a free AI analysis of GLD today
Analysis
TECHNICAL INDICATORS
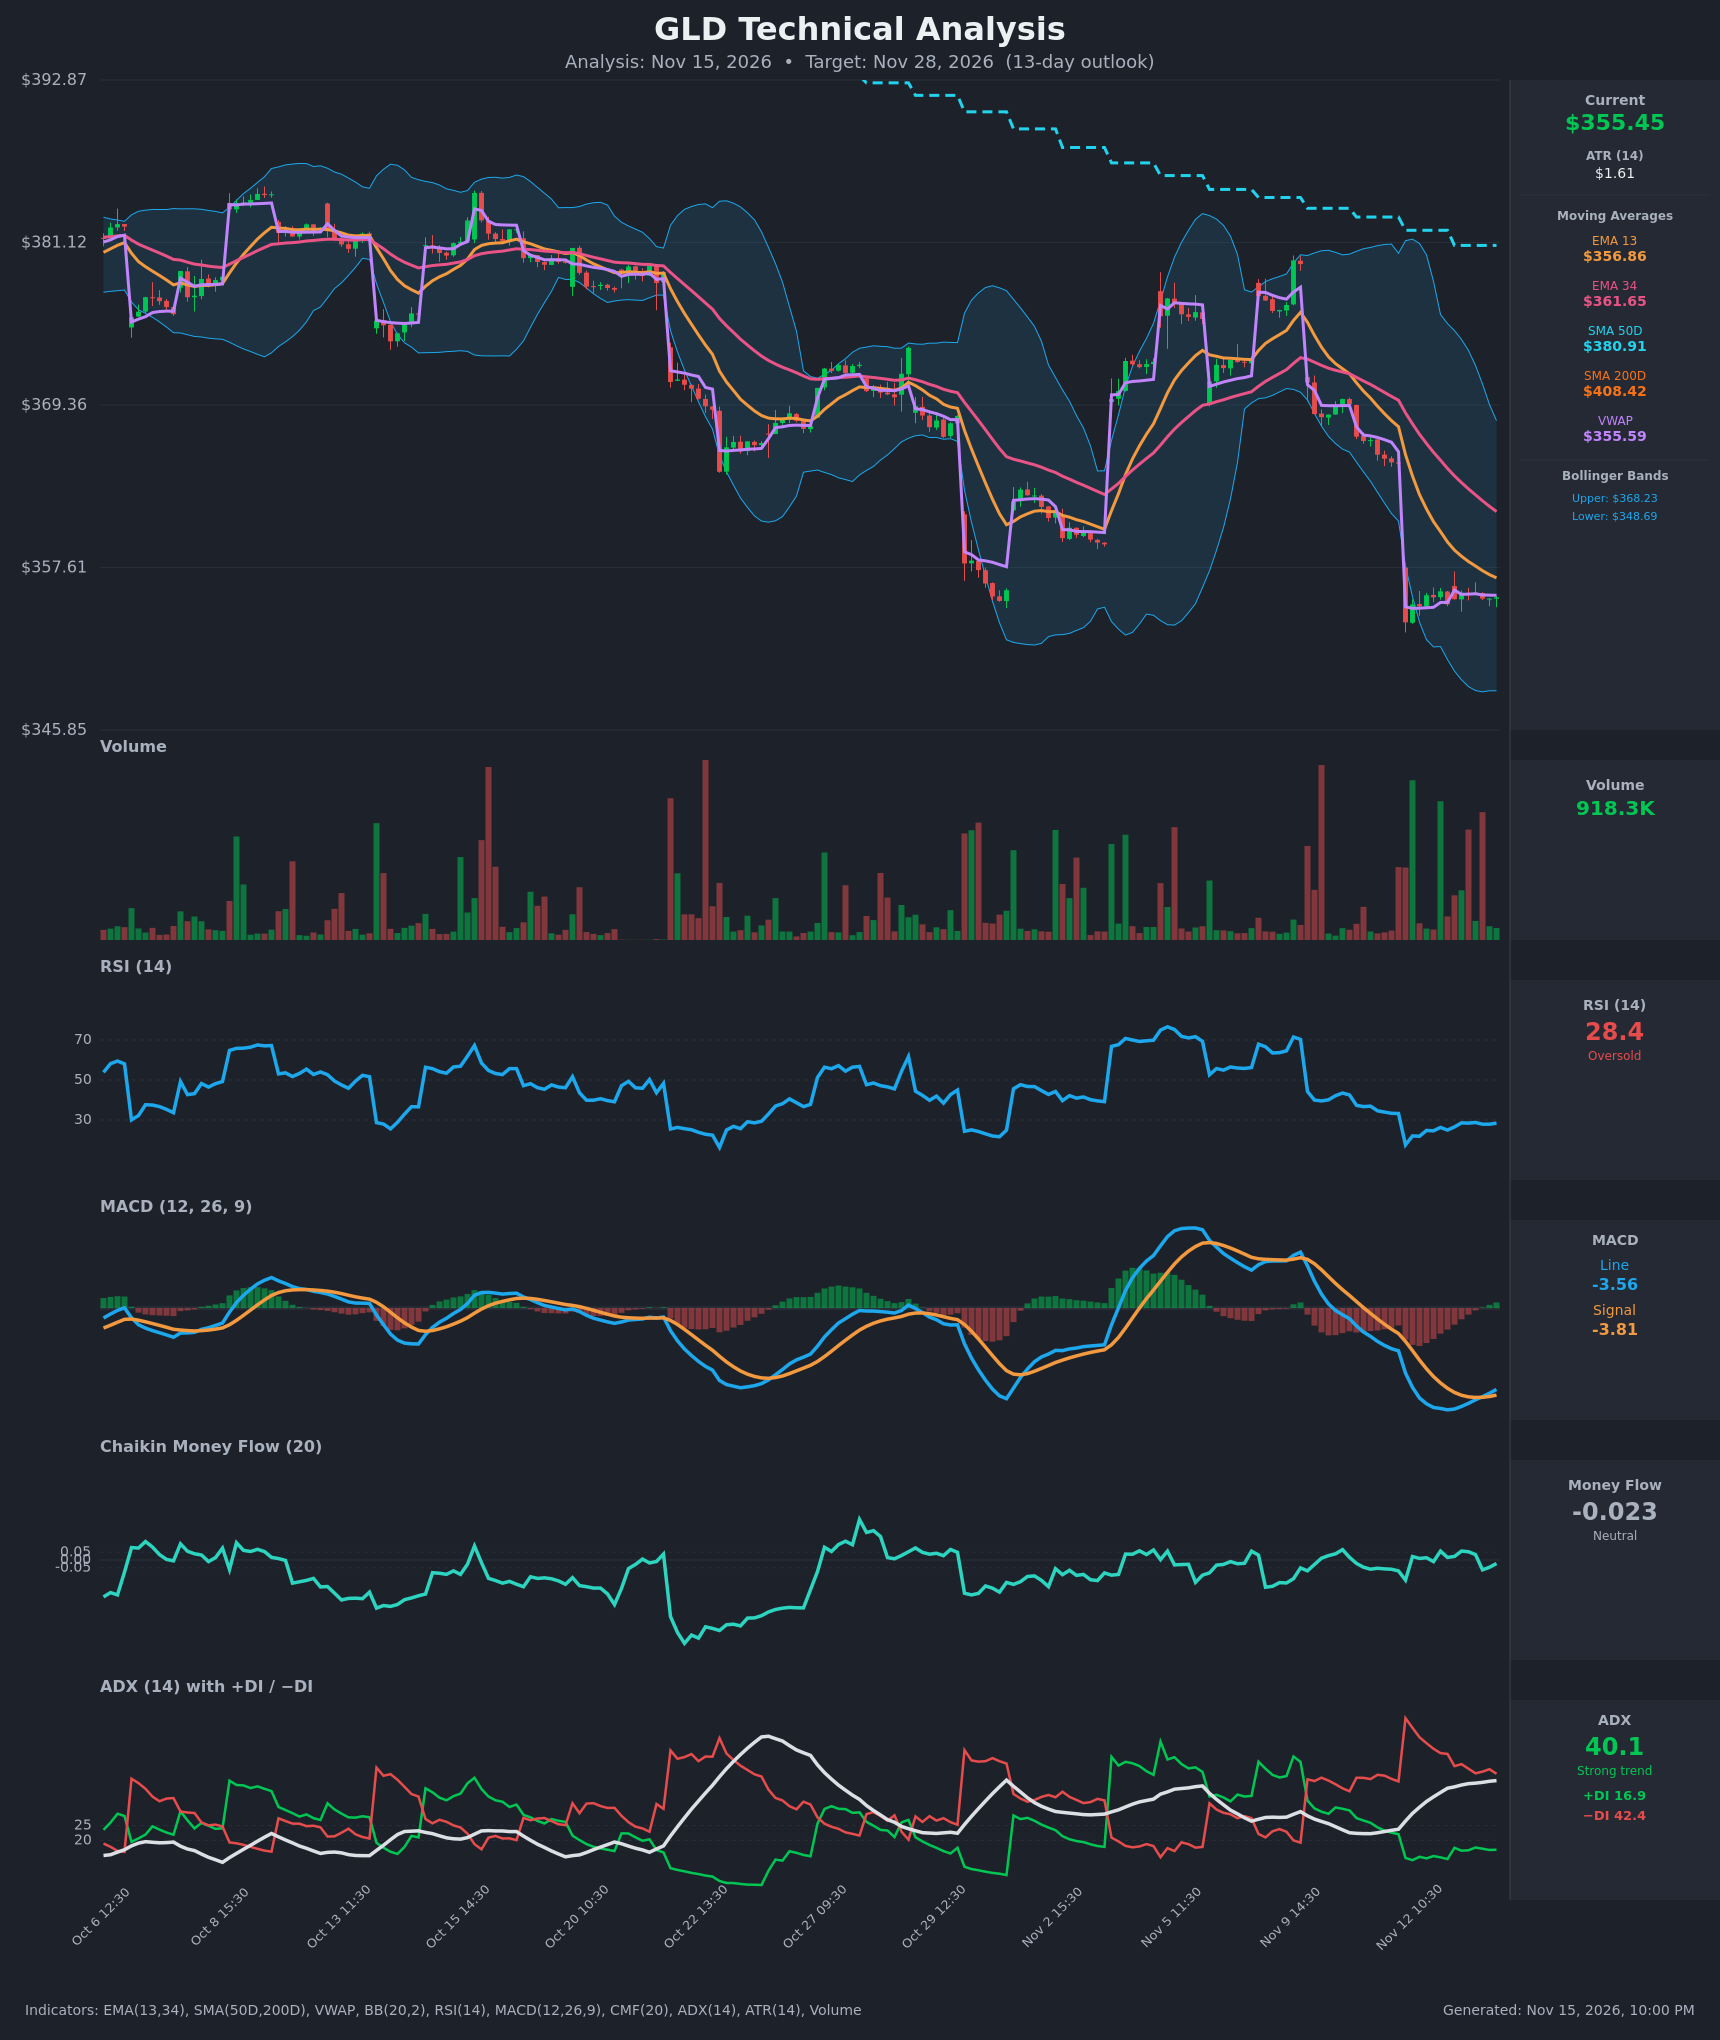
- RSI (14): 28.42, in oversold territory. It bottomed at 17.6 on Nov 12 and has recovered to the high 20s while price moved sideways. Momentum is stabilizing but still below 30. [Bullish]
- 20 EMA: The chart supplies EMA 13 ($356.86) and EMA 34 ($361.65) instead. Price at $355.45 is below both, and both are sloping down. EMA 13 is converging toward price, so selling pressure is fading, but both act as overhead resistance. [Bearish]
- MACD: Line -3.558 vs signal -3.805, so the line has just crossed above the signal (a small bullish crossover on Nov 13 13:30). The histogram is only slightly positive and both lines are deeply negative, so this is early, low-conviction momentum improvement. [Bullish]
- Bollinger Bands (20): Upper $368.23, lower $348.69, middle about $358.5. Price is in the lower half, below the midline, after a gap-down tag of the lower band. The bands are wide, which reflects the recent volatility expansion. [Neutral]
- CMF (20): -0.023, inside the ±0.05 neutral zone. It hovers around zero after small positive prints, so there is no heavy distribution during the sideways drift. [Neutral]
- ADX (14): 40.1 and rising, with −DI 42.4 on top of +DI 16.9. This is a strong, mature downtrend with the bears clearly in control. A reading this high after a sharp drop also raises the odds of trend exhaustion and a counter-trend bounce. [Strong Trend – Bearish]
- Volume: 918.3K, with heavy volume on the Nov 12 gap-down and diminishing volume during the sideways base. Selling climax volume followed by quieter trade suggests sellers are tiring. [Neutral to Mildly Bullish]
DIVERGENCES & TRENDS
- Long-term trend: Price is far below SMA50D ($380.91) and SMA200D ($408.42), with the 50D under the 200D. This is a bearish long-term structure with lower highs and lower lows since early November.
- Moving averages: EMA13 is below EMA34, a bearish crossover already in place. The gap between them is narrowing (about $4.80 now), so price is stalling.
- RSI vs price: Price has been flat at about $355 for over a day while RSI rose from 17.6 to about 28. This is a mild momentum improvement, not a classic divergence.
- MACD: The line crossed above the signal from deeply negative territory. These crossovers have preceded rebounds earlier in this chart (late Oct, early Nov), but they have often been followed by lower highs.
- VWAP: Price ($355.45) sits right at VWAP ($355.59). That is neutral, with balanced buying and selling after the gap.
- Pattern in the data: Prior sharp drops on this chart (Oct 22 area and the early-Nov gap) were followed by multi-day mean-reversion bounces toward the EMAs.
CHART PATTERNS
- Bearish Flag / Pennant (continuation): After the sharp gap drop from $365 to $353, price has formed a tight horizontal base between about $353.6 and $356. This resembles a bearish flag. A breakdown below about $353 would project a measured move of roughly $11 (the size of the drop), toward $342–343.
- Rectangle / base at the lower Bollinger Band: A horizontal range near oversold RSI could also be an accumulation base. A reversal pattern needs a close above about $358–359, followed by $361.65 (EMA34).
- Larger structure: Lower highs from $381 down to $365 form a descending channel. Resistance is stacked at $361.65 (EMA34), $365 (gap origin) and $368 (upper band).
- The trend is clearly bearish, but the extremes in RSI and ADX favor a relief bounce over continued straight-line selling.
POTENTIAL SCENARIOS
- Scenario 1: Bullish Oversold Relief Bounce — Oversold RSI, a MACD bullish cross, fading volume, and a base at the lower band lead to mean reversion toward the EMAs. Trigger: hourly close above $358.50 (BB midline), then above EMA34 at about $361.65. Target: $361–365. Invalidation: close below $353. (50% probability)
- Scenario 2: Bearish Flag Breakdown / Trend Continuation — The sideways base resolves lower in line with ADX 40 and −DI dominance. Trigger: break and close below $353.00 with rising volume. Target: $348.70 (lower band), then $343 (measured move). Invalidation: close above $359. (35% probability)
- Scenario 3: Neutral Range Chop — Price keeps oscillating between $352 and $360 as the trend digests the drop. Trigger: failure to break either $353 or $359. Target: $354–358. Invalidation: decisive close outside the range. (15% probability)
PRICE TARGETS
Timeframe: 13 days (target date Nov 28, 2026).
Range check: $345.00 to $372.00 is $27.00 wide, about 7.6% of $355.45. This fits the 7–10 day band and sits at the low end of the 14–21 day band, appropriate for 13 days.
- Target Price: $361.50
- Expected Range: $345.00 to $372.00
- Key Levels: Support at $353.00, Resistance at $365.00
OVERALL BIAS
OVERALL BIAS: BULLISH - The downtrend is strong (ADX 40, −DI dominant), but RSI is oversold at 28 after a capitulation-style gap with volume fading, the MACD has crossed up, and price is stabilizing at the lower Bollinger Band. A mean-reversion bounce toward EMA34 (~$361.5) is the most likely outcome. Conviction is modest because every moving average is still bearish and a bearish flag breakdown below $353 is a real risk.
This is educational analysis and not financial advice.