EEM 13-day bearish forecast — Nov 15, 2026
- Bias: Bearish
- Timeframe: 13 days (made Nov 15, 2026, target date Nov 27, 2026)
- Price at analysis: $60.92
- Price target: $60.20
- Expected range: $58.40 – $63.20
- Result: Pending — graded after the close on Nov 27, 2026
Get a free AI analysis of EEM today
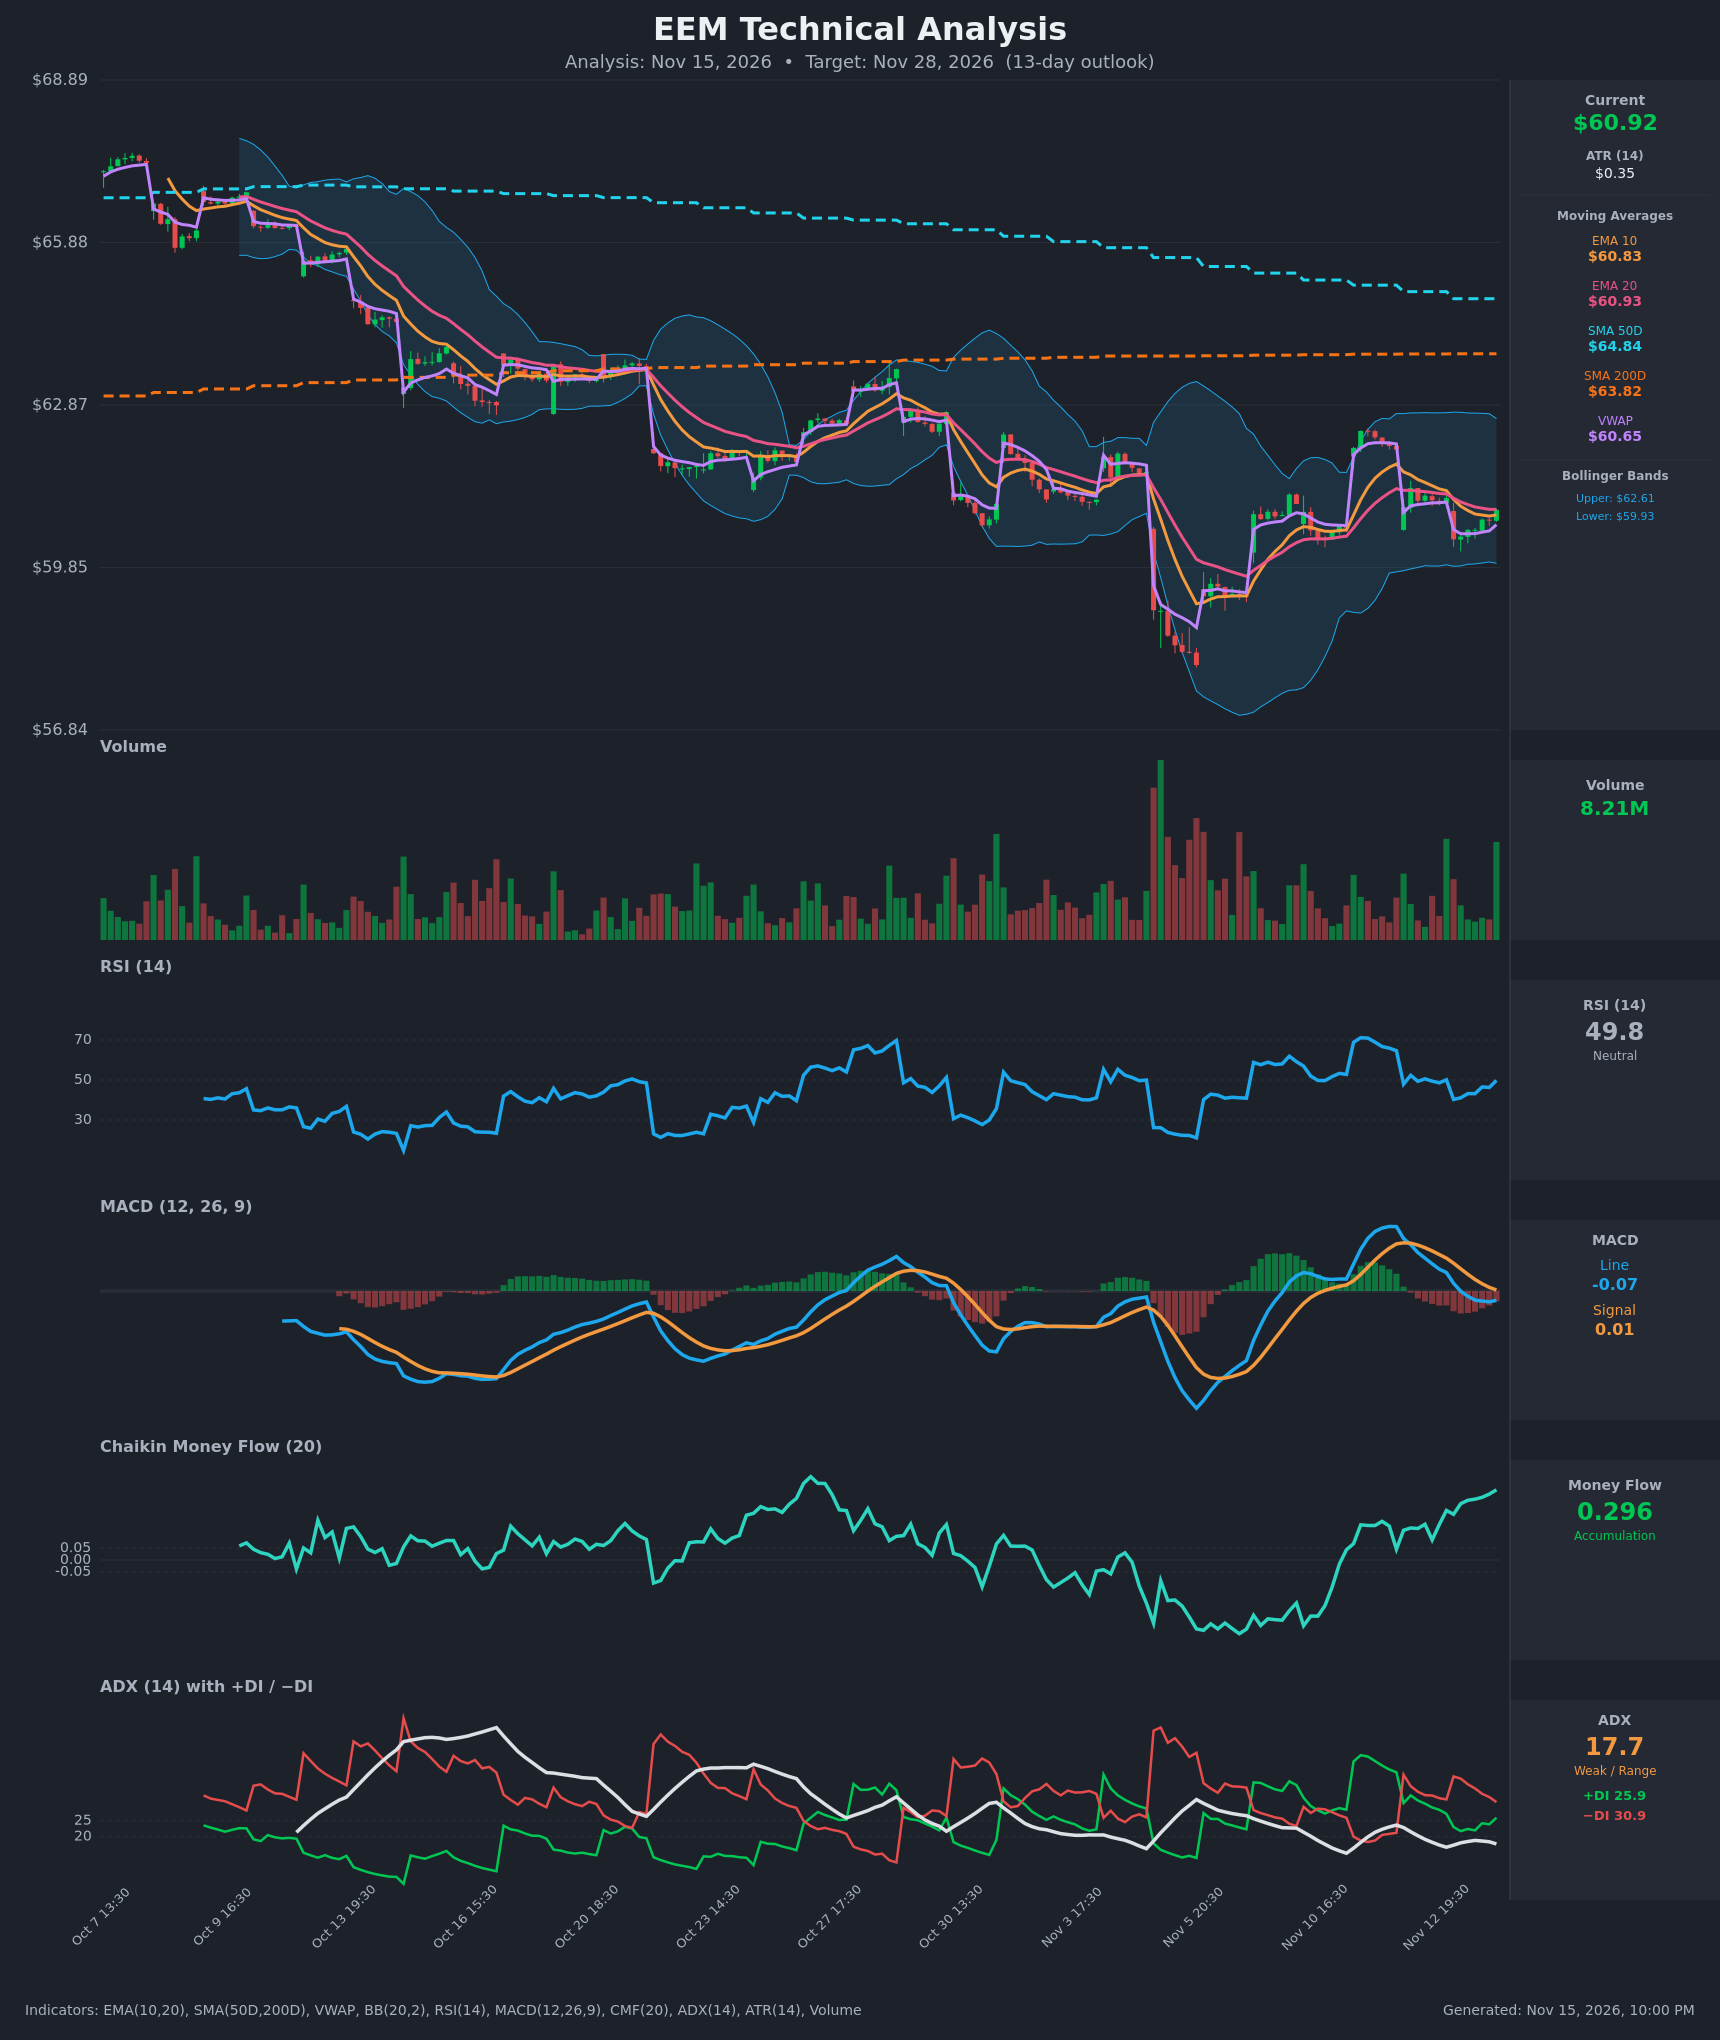
Analysis
TECHNICAL INDICATORS
- RSI (14): 49.77, right at the midline. It bounced from 40.3 on Nov 13 and is rising, but it has not shown real strength. Momentum is neutral with a slight recovery tilt. [Neutral]
- 20 EMA: $60.93, with price at $60.92, so price is sitting on it. EMA10 ($60.83) is below EMA20, a mild bearish alignment that has persisted since Nov 13. Both EMAs are rolling over and sit well below the SMA50 ($64.84) and SMA200 ($63.82). [Bearish]
- MACD: Line -0.072 is below signal +0.008 and negative. The bearish crossover happened on Nov 13 and the histogram is slightly negative. The line is flattening, so downside momentum is fading but not yet reversed. [Bearish]
- Bollinger Bands (20): Upper $62.61, lower $59.93, midline about $61.27. Price is in the lower half of the bands. The bands have narrowed after the volatile early-November selloff, which points to a volatility squeeze and a coming expansion. [Neutral]
- CMF (20): 0.296, well above +0.05 and rising steadily from deeply negative readings in early November. This is clear accumulation, and it diverges positively from flat-to-lower price. [Accumulation]
- ADX (14): 17.7 and falling, so the trend is weak or range-bound. −DI (30.9) is above +DI (25.9), so bears have a slight edge, though the gap is narrowing. [Weak Trend, Bearish lean]
- Volume: 8.21M, a spike on the latest bar, which was an up bar. Volume is average to slightly above recent days but far below the capitulation volume of the Nov 5-6 selloff. It shows no strong conviction either way. [Neutral / mild buying interest]
DIVERGENCES & TRENDS
- CMF vs price: CMF has climbed from the lows to 0.296 while price is still making lower highs. This is a bullish divergence and suggests dip buying, but it has not yet shown up in price.
- Long-term trend: Price is below both the SMA50 ($64.84) and SMA200 ($63.82), and the SMA50 is falling toward the SMA200. There is no death cross yet, but the gap is closing and the trend structure is bearish.
- MACD and RSI: MACD crossed bearish on Nov 13 and the line is flattening near zero. RSI has reset from 64 to about 50 without breaking below 40, which signals a loss of upside momentum without fresh selling.
- DI lines: −DI has stayed above +DI since Nov 12, but ADX is below 20, so this is a drifting market rather than a trending one.
- VWAP: Price ($60.92) is slightly above VWAP ($60.65), which is a minor positive.
- Lower highs: The sequence of rallies has topped at about $63.3, then $62.4, then $62.0, which is a bearish structure.
CHART PATTERNS
- Descending trend / bearish flag-like consolidation: After the sharp drop to about $58 on Nov 5-6, price has rebounded and is consolidating in a roughly $60.2-$62.4 range. Within the broader downtrend of lower highs, this resembles a Bearish Flag / Rectangle. A break below about $59.90 would target the Nov 6 low area ($58.0-$58.5), roughly the measured move of the earlier leg.
- Symmetrical-triangle-like compression: The narrowing Bollinger Bands and shrinking range suggest a coil. A decisive break is likely, and the dominant trend favors the downside.
- Bullish counterpoint: A weak resemblance to a Bullish Double Bottom (the Nov 6 low and a higher low around $60.2) would be confirmed only by a close above $62.4-$62.6, with a target near the SMA200 at about $63.8.
POTENTIAL SCENARIOS
- Scenario 1: Bearish Breakdown of the Range — The weak rebound fails below the declining EMAs and the lower highs persist, with −DI staying on top. Price slips through the lower Bollinger Band and the bearish flag resolves lower. Trigger: a close below $59.90 on rising volume. Target: $58.60-$59.30, with an interim target around $60.20 by day 13. Invalidation: a close above $62.60. (45% probability)
- Scenario 2: Bullish Accumulation Breakout — CMF accumulation proves right, and price reclaims the EMAs and VWAP and pushes toward the upper band as MACD turns up. Trigger: a close above $61.60 and then $62.60. Target: $63.20-$63.80 (SMA200). Invalidation: a close below $60.20. (30% probability)
- Scenario 3: Neutral Range Chop — A weak ADX keeps price oscillating between about $60.0 and $62.3, near the EMAs. Trigger: failure of both breakouts. Target: $60.80-$61.50. Invalidation: a close outside $59.90-$62.60. (25% probability)
PRICE TARGETS
- Target Price: $60.20 (13-day horizon)
- Expected Range: $58.40 to $63.20 (width $4.80, about 7.9% of current price, in line with the 7-10 day to 14-day guidance)
- Key Levels: Support at $59.93 (lower Bollinger Band, near the range low), Resistance at $62.61 (upper Bollinger Band, near the recent swing high)
OVERALL BIAS
OVERALL BIAS: BEARISH - Price remains below the falling SMA50 and SMA200 with lower highs, a bearish MACD crossover, and −DI above +DI. Strong CMF accumulation tempers conviction, so the expected drift lower is modest, toward about $60.20, unless $62.60 is reclaimed.
This is educational analysis and not financial advice.