MARA 13-day bearish forecast — Nov 15, 2026
- Bias: Bearish
- Timeframe: 13 days (made Nov 15, 2026, target date Nov 27, 2026)
- Price at analysis: $6.99
- Price target: $6.75
- Expected range: $6.20 – $7.40
- Result: Pending — graded after the close on Nov 27, 2026
Get a free AI analysis of MARA today
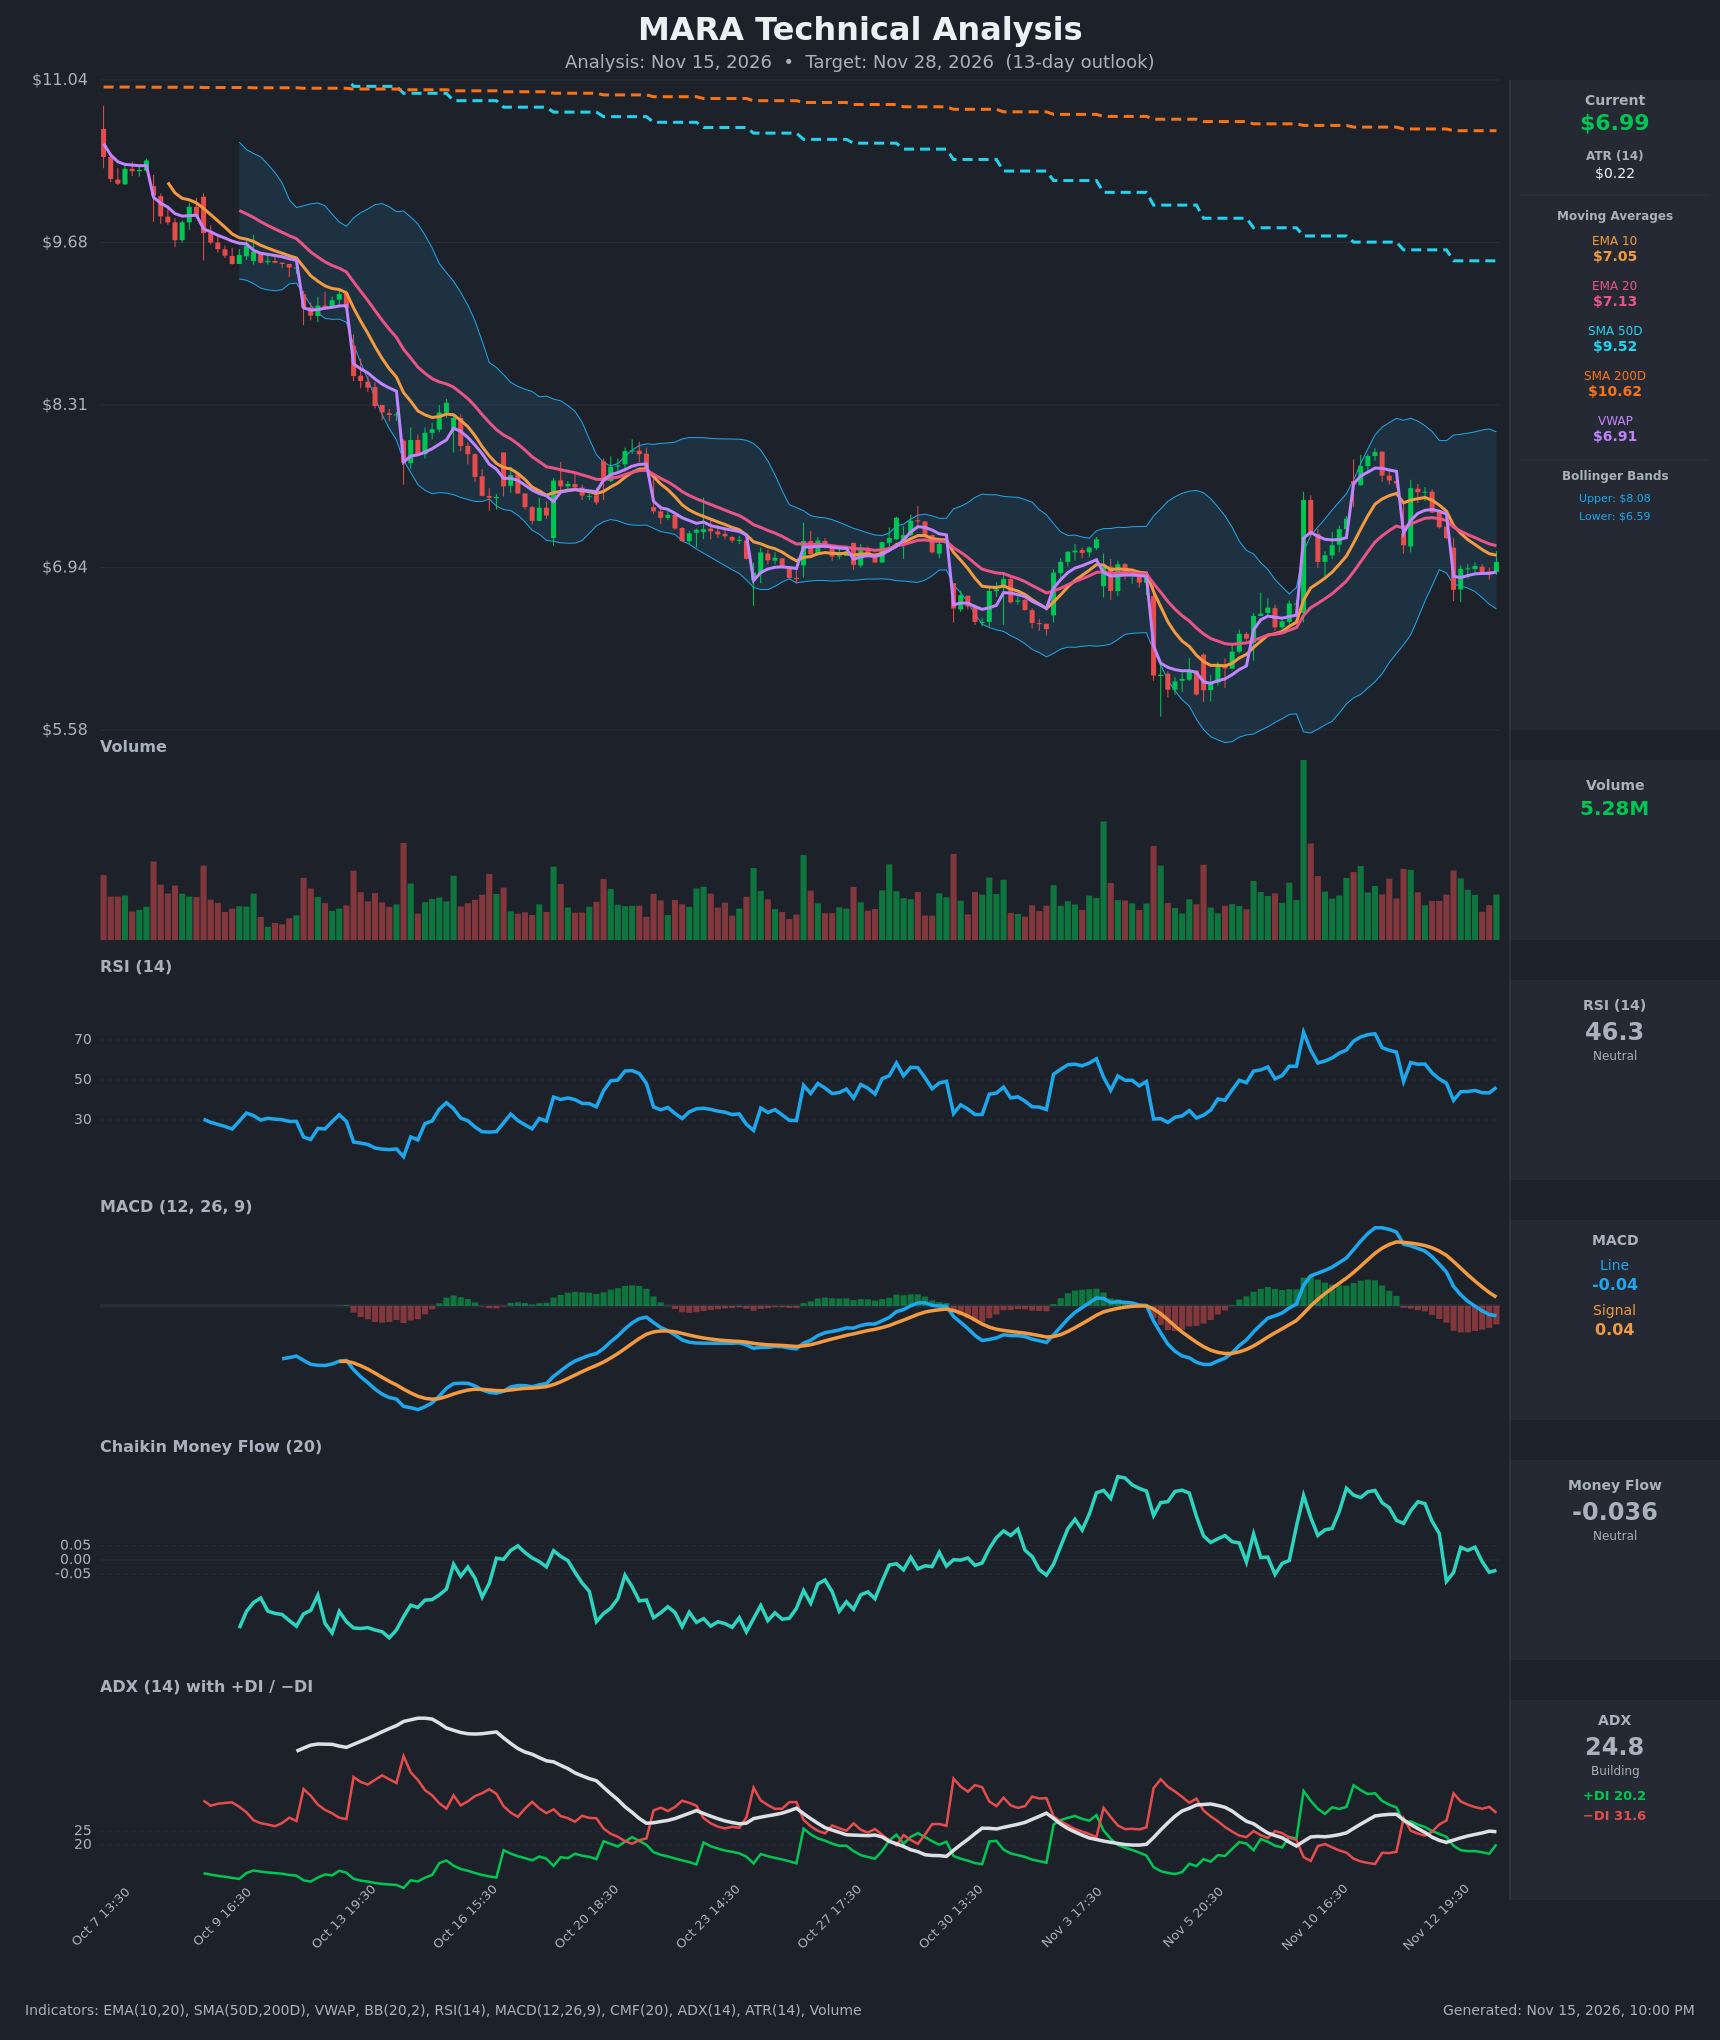
Analysis
TECHNICAL INDICATORS
- RSI (14): 46.30, slipping from the high 50s on Nov 12 and a low of ~40 on Nov 13. It sits just below the midline, with momentum soft and no oversold bounce yet. [Neutral]
- 20 EMA: $7.1266, with price ($6.99) below it. EMA10 ($7.05) has crossed below EMA20 and both are sloping down, so the EMA20 is overhead resistance. [Bearish]
- MACD: Line -0.0439 crossed below signal 0.0384 on Nov 13. The histogram is negative and widening, so short-term momentum is turning down. [Bearish]
- Bollinger Bands (20): Upper $8.08, lower $6.59, with price in the lower half and below the midline (~$7.34). The bands are still wide after the earlier volatility spike. There is ~$0.40 of room to the lower band. [Bearish]
- CMF (20): -0.036, which is neutral but fading from +0.2 on Nov 12. Money flow is oscillating around zero and has lost its accumulation. [Neutral]
- ADX (14): 24.8, near the 25 threshold and building. −DI (31.6) is well above +DI (20.2), so bears control a modest trend. [Moderate Trend – Bearish]
- Volume: 5.28M, average to slightly below average, with no capitulation or surge. The recent drop came on moderate selling and the bounce volume is unremarkable. [Neutral / mild lack of buying conviction]
DIVERGENCES & TRENDS
- No clear divergence. Price made a lower high (~$7.65 → $7.0) alongside a falling RSI and MACD, which is consistent rather than divergent.
- The MACD bearish crossover (Nov 13) and the EMA10 < EMA20 cross confirm short-term weakness after the Nov 10–11 rally to ~$7.7.
- The long-term trend is firmly bearish. Price is below SMA50 ($9.52) and SMA200 ($10.62), and SMA50 is below SMA200 (death cross already in place).
- −DI has been above +DI since Nov 12 and ADX is rising toward 25, so the downtrend is regaining strength.
- Price is hugging VWAP ($6.91) and trades just above it, which offers minor support.
- The lows around $6.0–$6.2 (Nov 5–6) are the major swing support.
CHART PATTERNS
- The broader structure is a long downtrend with a V-shaped bounce from ~$6.0 to ~$7.7. This has been followed by a lower high and a pullback, resembling a Bearish Flag/Pennant-type continuation or a failed rally within a larger descending structure.
- The recent range of ~$6.0–$7.7 looks like a base. The rally and the retracement into it may be forming a Double Bottom-like structure, but this is not confirmed because price has not broken above the $7.7 neckline.
- The pattern reading is a lower high at $7.7 versus the prior $8.0+ area, in a downtrend. Measured downside is back toward the $6.2–$6.4 area. Confirmation requires a break below ~$6.75, the Nov 13 low.
POTENTIAL SCENARIOS
- Scenario 1: Bearish Continuation Lower — The MACD and EMA crossovers, −DI dominance and the death-cross backdrop favor a retest of the lower Bollinger Band and the swing lows. Trigger: break below $6.75 (Nov 13 low) and VWAP $6.90 on rising volume. Target: $6.30–$6.50. Invalidation: close above EMA20/$7.13, especially above $7.40. (50% probability)
- Scenario 2: Neutral Range Chop — Price consolidates between the $6.60 lower band and the $7.15 EMA20, with ADX stalling below 25. Trigger: ADX rolls over and CMF stays near zero. Target: $6.80–$7.10. Invalidation: close outside $6.50–$7.40. (28% probability)
- Scenario 3: Bullish Relief Bounce — A bounce off the lower band and VWAP pushes back toward the Bollinger midline. Trigger: reclaim of $7.13 with MACD curling up and CMF above +0.05. Target: $7.50–$7.70. Invalidation: loss of $6.75. (22% probability)
PRICE TARGETS
- Target Price: $6.75 (13-day)
- Expected Range: $6.20 to $7.40 (width $1.20 ≈ 17% of the current price, consistent with a 13-day horizon on a volatile stock; ATR of $0.22 supports a wide range)
- Key Levels: Support at $6.59 (lower Bollinger Band, followed by the $6.00–$6.20 swing lows), Resistance at $7.13 (EMA20, followed by $7.65)
OVERALL BIAS
OVERALL BIAS: BEARISH - The MACD bearish crossover, EMA10 below EMA20, −DI dominating with ADX rising toward 25, and price below the 50- and 200-day SMAs all favor a drift lower toward the lower Bollinger Band. CMF is fading from positive to neutral and no reversal pattern has been confirmed.
This is educational analysis and not financial advice.