IREN 13-day bearish forecast — Nov 15, 2026
- Bias: Bearish
- Timeframe: 13 days (made Nov 15, 2026, target date Nov 27, 2026)
- Price at analysis: $18.16
- Price target: $17.30
- Expected range: $16.50 – $18.80
- Result: Pending — graded after the close on Nov 27, 2026
Get a free AI analysis of IREN today
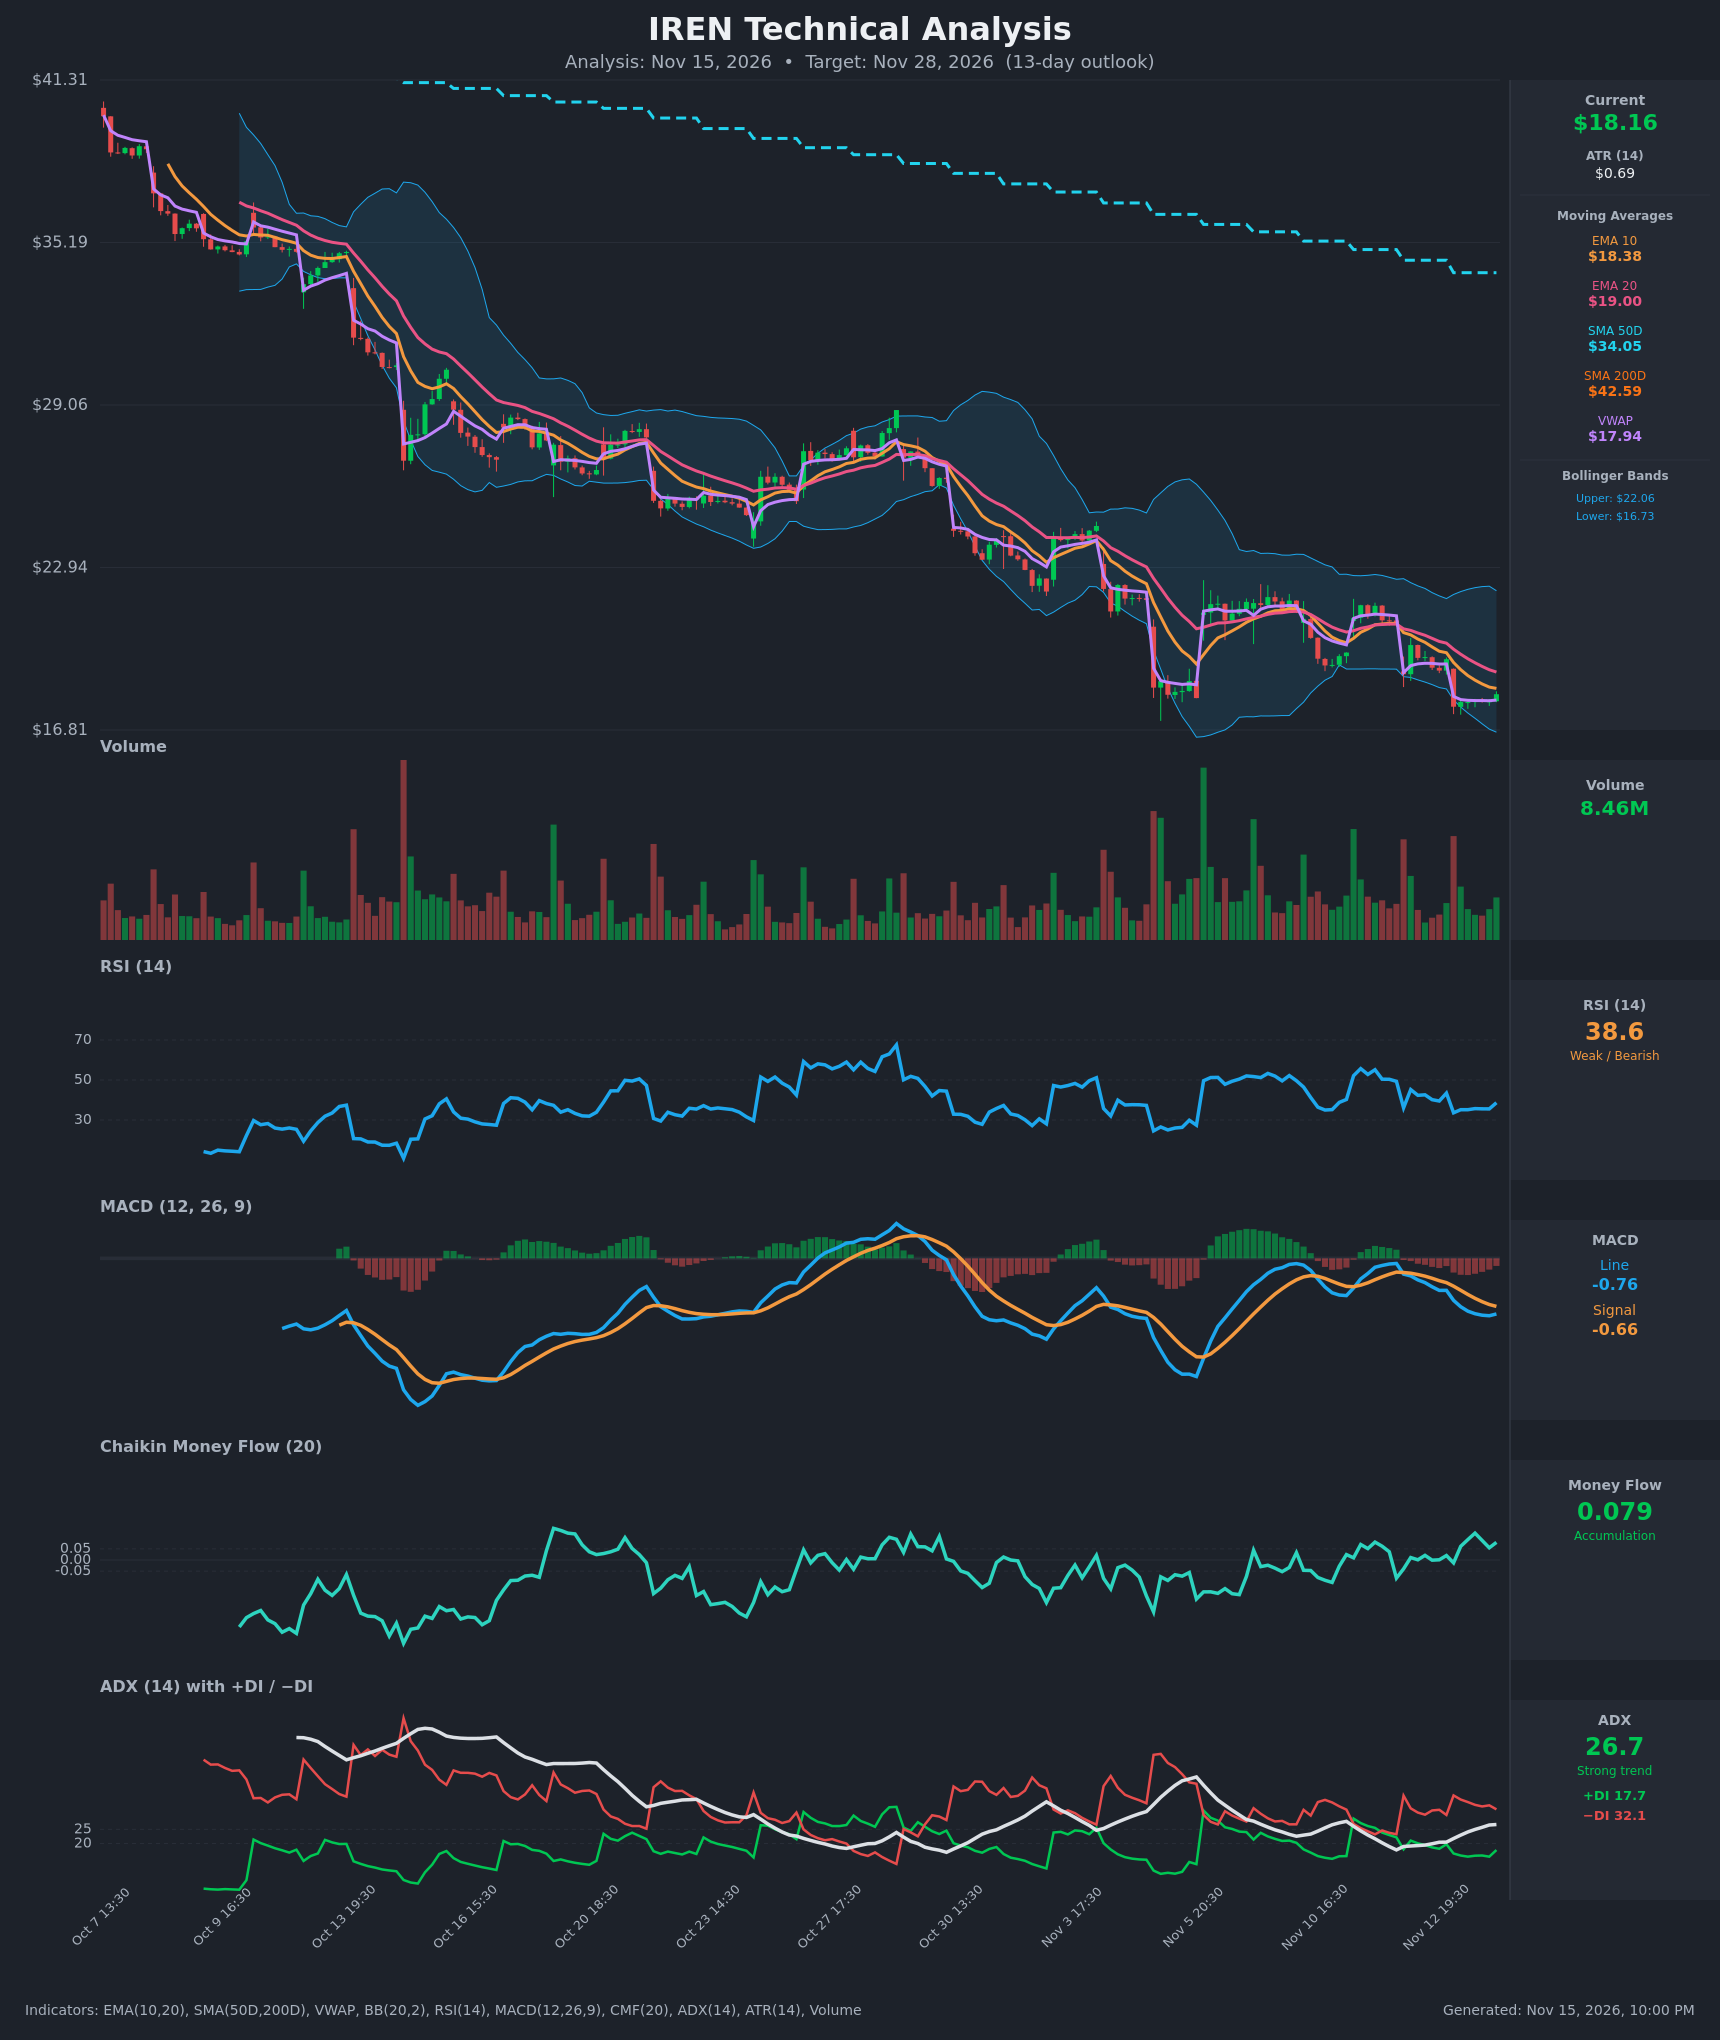
Analysis
TECHNICAL INDICATORS
- RSI (14): 38.64, in the weak half of the range and above oversold (30). It bounced from about 33.6 on Nov 13 but has made lower highs through the session. Momentum is soft but not washed out. [Bearish]
- 20 EMA: $18.995, with price at $18.16 below it. EMA10 ($18.38) is also below EMA20 and both are sloping down, so the EMAs act as dynamic resistance. EMA10 has been below EMA20 since Nov 12. [Bearish]
- MACD: Line -0.761 is below Signal -0.657, a histogram of about -0.10. The line crossed below the signal on Nov 12-13 and has stayed below it. The last bar shows a slight uptick in the line, so the downside momentum may be flattening, but there is no bullish cross. [Bearish]
- Bollinger Bands (20): Upper $22.06, lower $16.73, midline about $19.40. Price sits in the lower half of the bands, about $1.43 above the lower band. It has been walking down the lower half since the early-Nov breakdown. There is no squeeze, and the lower band at $16.73 is the next volatility target. [Bearish]
- CMF (20): +0.079, above the +0.05 threshold and trending up from negative readings. That suggests dip-buying or accumulation near $17.7-17.9. It conflicts with the price trend and is the main bullish counterpoint. [Accumulation]
- ADX (14): 26.7 and rising, above 25, with −DI at 32.1 versus +DI at 17.7. Sellers hold a wide DI gap and the downtrend is gaining strength. [Strong Trend - Bearish]
- Volume: 8.46M, moderate and unremarkable, with no capitulation spike. The last bar was a small green candle on average volume, so the bounce lacks conviction. Selling spikes in the past were not followed by sustained rallies. [Neutral to mildly Bearish]
DIVERGENCES & TRENDS
- Long-term structure: Price ($18.16) is far below SMA50D ($34.05) and SMA200D ($42.59). The death cross has already happened and the gap is still wide, so the long-term trend is firmly down. The price drop from about $41 to $18 has been persistent, with lower highs and lower lows.
- VWAP: Price at $18.16 is just above VWAP at $17.94, a minor positive. VWAP has been a magnet for price and the bounce is small.
- CMF divergence: CMF is rising while price makes new lows (the Nov 13 low of $17.69 against the Nov 5 low). This is a mild bullish divergence that could support a relief bounce, but it is not a confirmed reversal.
- RSI: It made a higher low (33.6 on Nov 13) versus roughly 25-27 on Nov 5. Even so, RSI stays under 50 and has not reclaimed its prior range. There is no clear bullish divergence on price.
- MACD: The line is below zero and below its signal, with the histogram negative. The descent is flattening slightly but the bearish cross remains intact.
- ADX/DI: −DI has been above +DI since Nov 11 and ADX has risen from about 17.7 to 26.7, which confirms trend strength.
CHART PATTERNS
- Bearish rectangle / flag-type consolidation breakdown: Price consolidated in about $17.7-$21.8 through Nov 5-12, with lower highs. It then broke below the range on Nov 13 and is now retesting underneath, close to a Bearish Flag/Pennant or bearish rectangle continuation from the reference. The measured move of the prior range (about $4) from the break near $18-19 points toward $14-15, though this is beyond a 13-day horizon.
- Descending channel: The macro trend since October is a series of lower highs and lower lows under a falling EMA20, which is bearish continuation.
- Counter-pattern: The $17.7-$18.2 base with rising CMF could become a short-term double bottom. It needs a close above $19.00 (EMA20) to confirm, so it is not validated.
POTENTIAL SCENARIOS
- Scenario 1: Bearish Trend Continuation — Price stays below EMA10/EMA20, ADX keeps rising and −DI dominates, and sellers press toward the lower Bollinger Band after a failed bounce. Trigger: a daily close below $17.69. Target: $16.70-$17.30, with an extension to about $16.00. Invalidation: a close above $19.00 (EMA20). (55% probability)
- Scenario 2: Neutral Base and Range — CMF accumulation holds price between $17.60 and $18.90, with chop around VWAP while ADX peaks. Trigger: holding $17.69 on retests, with RSI stabilizing in the 35-45 range. Target: $17.70-$18.70. Invalidation: a close below $17.60 or above $19.20. (20% probability)
- Scenario 3: Bullish Relief Bounce — A short-covering bounce driven by rising CMF and an oversold RSI, turning MACD up. Trigger: a close above EMA20 at $19.00 on rising volume. Target: $19.90-$20.80 (prior breakdown area). Invalidation: a failure back under $18.00. (25% probability)
PRICE TARGETS
- Target Price: $17.30 (13-day outlook)
- Expected Range: $16.50 to $18.80. The $2.30 width is about 12.7% of the current price, which is a little above the 10-14 day guidance. This is justified by high realized volatility.
- Key Levels: Support at $17.69 (recent low), with the lower Bollinger Band at $16.73 below it. Resistance at $18.38 (EMA10), with a stronger level at $19.00 (EMA20).
OVERALL BIAS
OVERALL BIAS: BEARISH - Price is below all key moving averages with a death cross in place, MACD is below its signal, and −DI (32.1) dominates +DI (17.7) with ADX rising above 25. Rising CMF and the proximity to the lower band argue for bounces, but the weight of evidence favors a drift lower toward about $17.30.
This is educational analysis and not financial advice.