MSTR 13-day bearish forecast — Nov 15, 2026
- Bias: Bearish
- Timeframe: 13 days (made Nov 15, 2026, target date Nov 27, 2026)
- Price at analysis: $111.59
- Price target: $107.50
- Expected range: $102.50 – $113.00
- Result: Pending — graded after the close on Nov 27, 2026
Get a free AI analysis of MSTR today
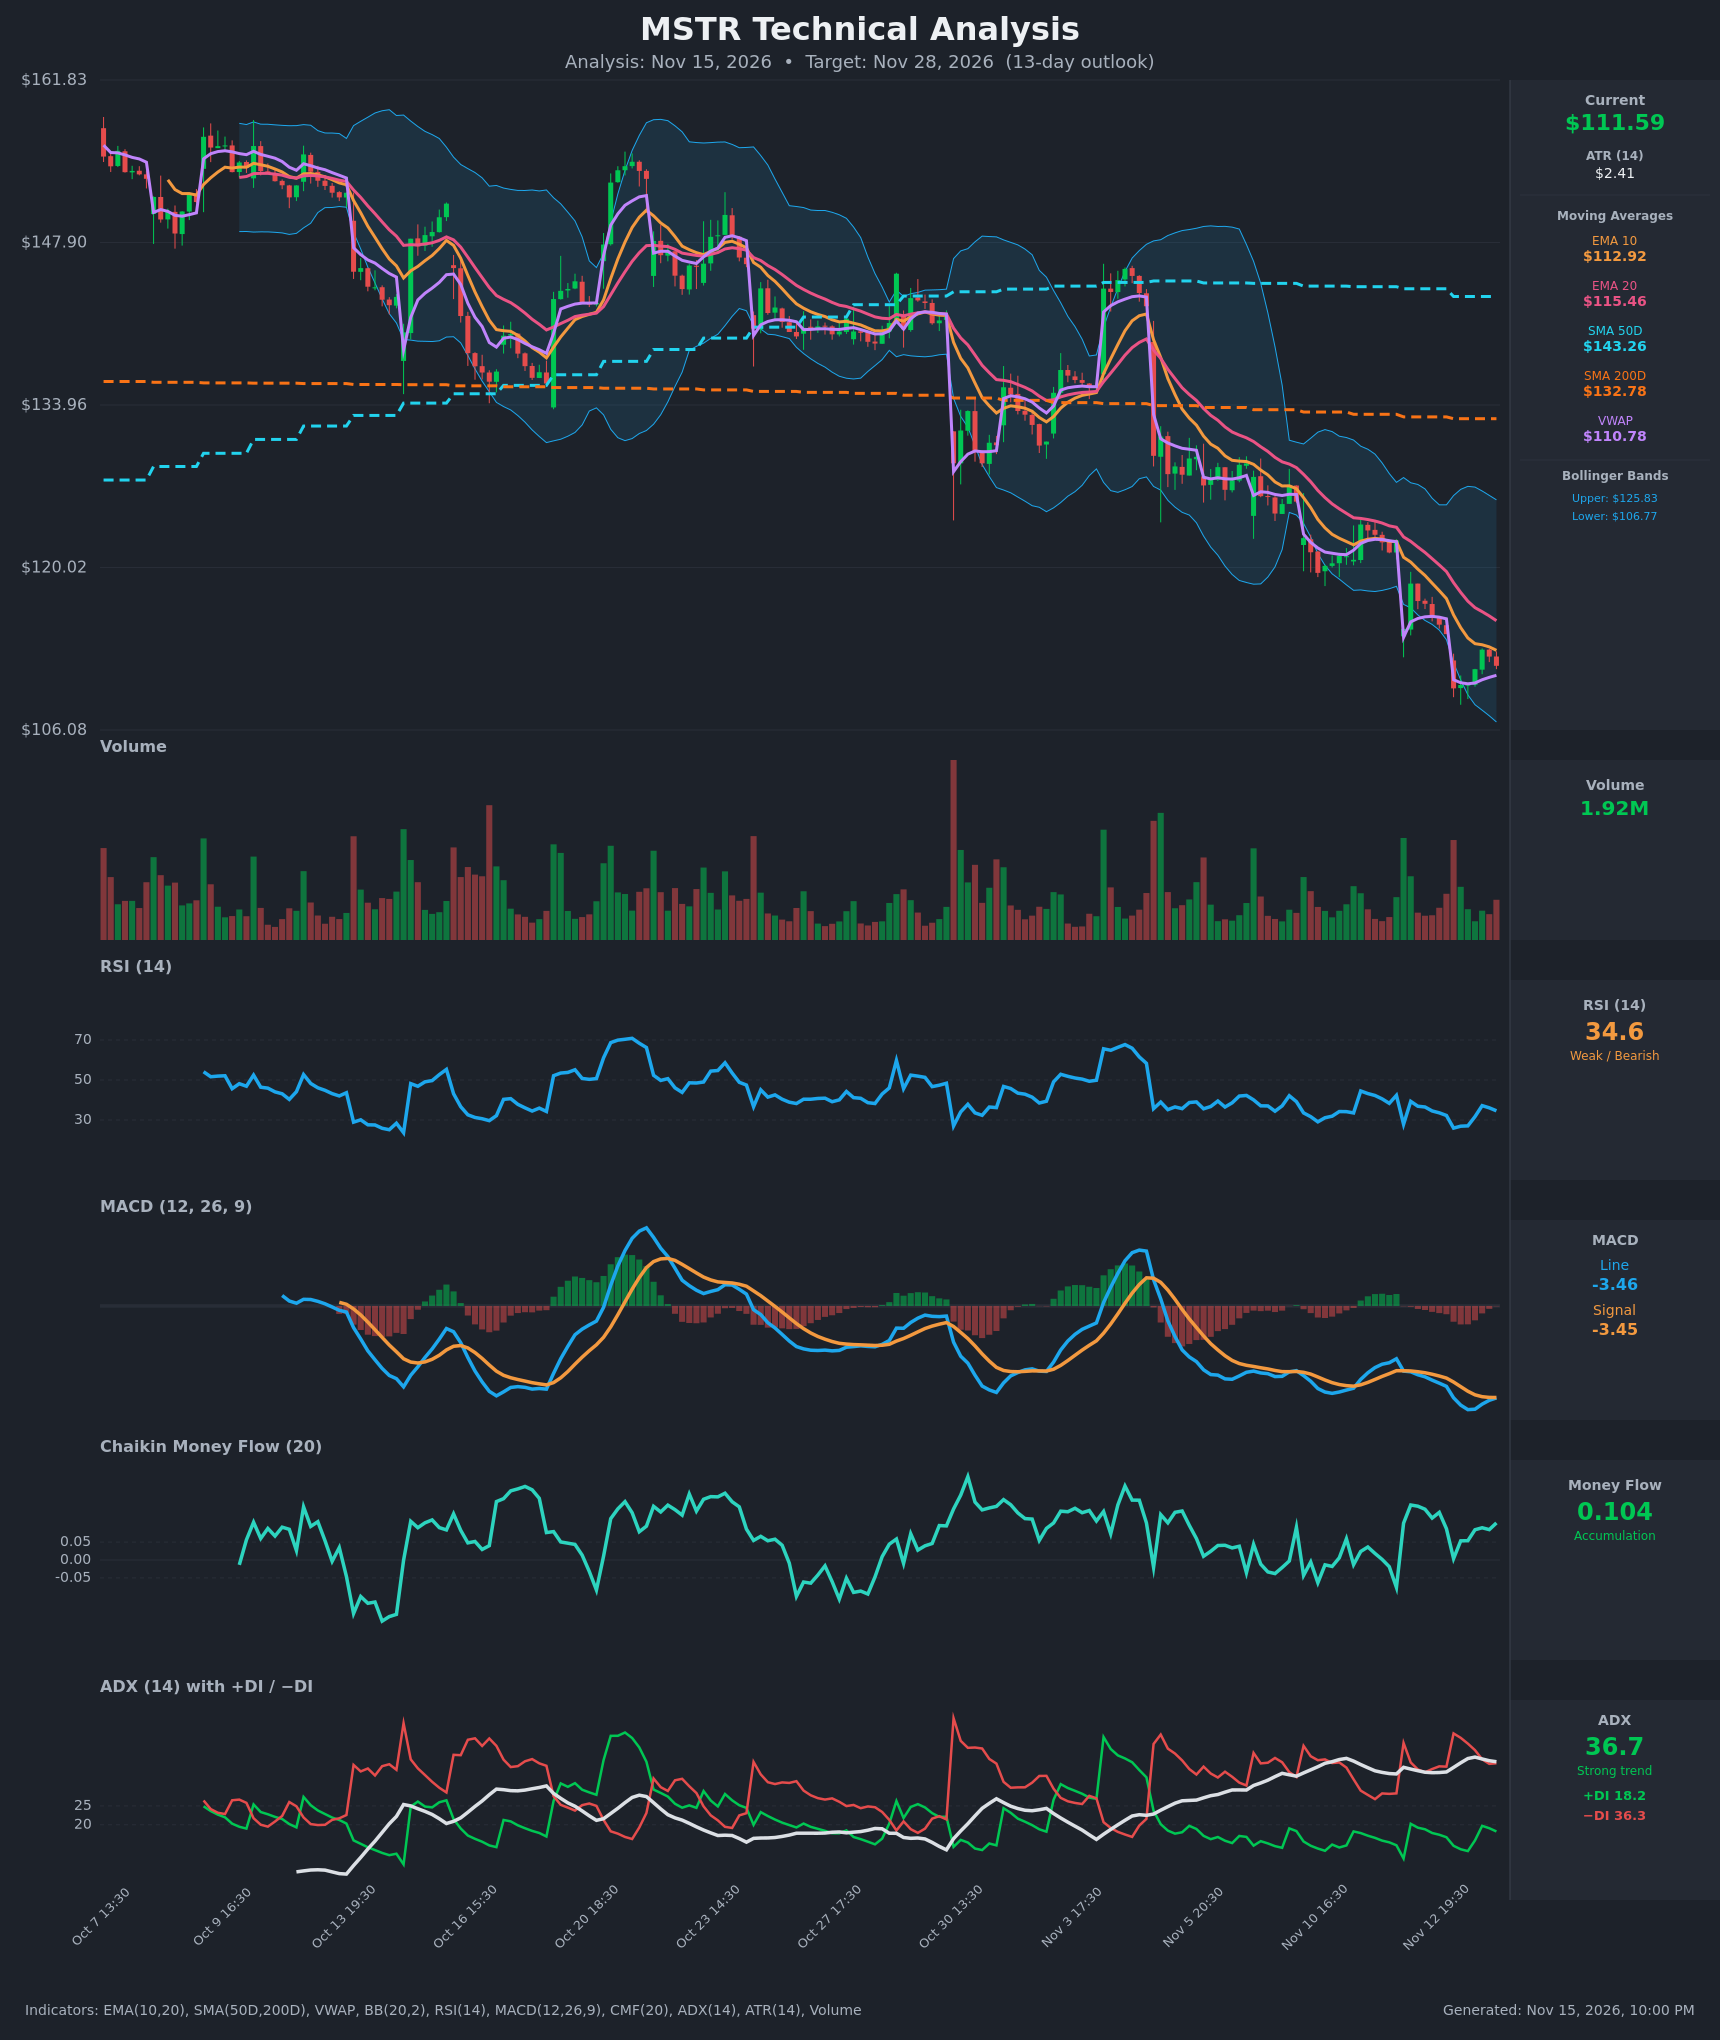
Analysis
TECHNICAL INDICATORS
- RSI (14): 34.6, just above the oversold line. It bounced from 25.9 on Nov 13 and has been stuck in a 26-37 band, so momentum is weak with no sign of a bullish regime shift. [Bearish]
- 20 EMA: $115.46, with the EMA10 at $112.92. Price at $111.59 is below both. EMA10 is below EMA20 and the gap is widening, so the EMAs act as overhead resistance. [Bearish]
- MACD: Line -3.461 vs signal -3.446, a histogram of about -0.015. Both lines are deeply negative. The histogram is flattening, so downside momentum is fading, but there is no bullish crossover yet. [Bearish]
- Bollinger Bands (20): Upper $125.83, lower $106.77, with price near the lower third at $111.59. The bands are expanding and sloping down, which is a "walking the band" downtrend. The bottom is only about 4% away, so a bounce is possible, but the trend still dominates. [Bearish]
- CMF (20): +0.104, above the +0.05 threshold. It has stayed positive through the selloff, so there is some dip buying. This conflicts with the price trend and is the main bullish counterpoint. [Accumulation]
- ADX (14): 36.7, a strong trend, with ADX above 25 and rising. −DI at 36.3 is far above +DI at 18.2, so bears are firmly in control. [Strong Trend – Bearish]
- Volume: 1.92M, with no capitulation spike on the latest bars. Volume was heavier on the down-gap sessions and lighter on the small bounces, so the bounces lack conviction. [Neutral-to-Bearish]
- Moving averages and VWAP: Price is below the SMA200 ($132.78) and the SMA50 ($143.26). SMA50 is still above SMA200, so no death cross has occurred, but the SMA50 is falling toward it. Price is slightly above VWAP ($110.78), which is a minor short-term support. [Bearish]
DIVERGENCES & TRENDS
- Bullish divergence (money flow): CMF has stayed positive (0.10) while price made new lows. This hints at accumulation, but it has not yet translated into price strength.
- Momentum: RSI made a higher low (about 27 to 28) versus the Nov 13 low (25.9) only marginally. MACD is flattening, so downside momentum is waning, not reversing.
- Trend: The market is in a clear lower-highs/lower-lows sequence, with gap-downs on Nov 12 and Nov 13. The EMA10 and EMA20 have been bearishly stacked since early November.
- Crossovers: MACD is converging on its signal line, so a bullish cross is possible within days. The −DI/+DI spread remains very wide, and no DI crossover is close.
- Long-term: Price is below the SMA200 and the SMA50 is rolling over. A death cross is a risk over coming weeks.
CHART PATTERNS
- Bearish Flag / Pennant (continuation): After the sharp drop from about $122 to about $110, price has consolidated in a tight $110-$113 range. A break below about $109.50 would suggest continuation, with a measured move toward the high $90s over a longer horizon. A more conservative 13-day target is the $105-$108 area.
- Descending channel: The series of lower highs and lower lows since early November defines the trend. The EMA20 near $115 is the channel's upper boundary.
- Falling wedge (bullish reversal) is not confirmed. The bands are expanding and there is no converging structure, so I do not rely on it. A close above $115-$116 would be needed to suggest a trend shift.
POTENTIAL SCENARIOS
- Scenario 1: Bearish Trend Continuation — The strong ADX and the dominant −DI favour another leg lower as the flag breaks down. Trigger: a hourly close below $109.50 with rising volume. Target: $106.77 (lower Bollinger Band), then about $104-$105. Invalidation: a close above $115.50 (EMA20). (50% probability)
- Scenario 2: Bullish Relief Bounce — RSI is near oversold, CMF shows accumulation, and the MACD histogram is flattening, so a mean-reversion bounce toward the moving averages is plausible. Trigger: a MACD bullish cross and a close above $113 (EMA10 reclaim). Target: $115.50-$118. Invalidation: a break below $108. (32% probability)
- Scenario 3: Neutral Consolidation — Price chops between about $107 and $114 as selling exhausts and buyers absorb supply. Trigger: failure to break either $109.50 or $115. Target: about $110-$112. Invalidation: a decisive close outside $106.50-$115.50. (18% probability)
PRICE TARGETS
- Target Price: $107.50 (13-day)
- Expected Range: $102.50 to $113.00 (width $10.50, about 9.4% of the current price, consistent with a 13-day horizon)
- Key Levels: Support at $106.77, Resistance at $115.46
OVERALL BIAS
OVERALL BIAS: BEARISH - ADX of 36.7 with −DI (36.3) far above +DI (18.2), price below all key moving averages, and bearish EMA stacking point to continuation. The conviction is modest because RSI is near oversold, CMF is positive, and the MACD histogram is flattening, which leaves room for a relief bounce.
This is educational analysis and not financial advice.