QUBT 13-day bearish forecast — Nov 15, 2026
- Bias: Bearish
- Timeframe: 13 days (made Nov 15, 2026, target date Nov 27, 2026)
- Price at analysis: $5.55
- Price target: $5.28
- Expected range: $4.85 – $5.85
- Result: Pending — graded after the close on Nov 27, 2026
Get a free AI analysis of QUBT today
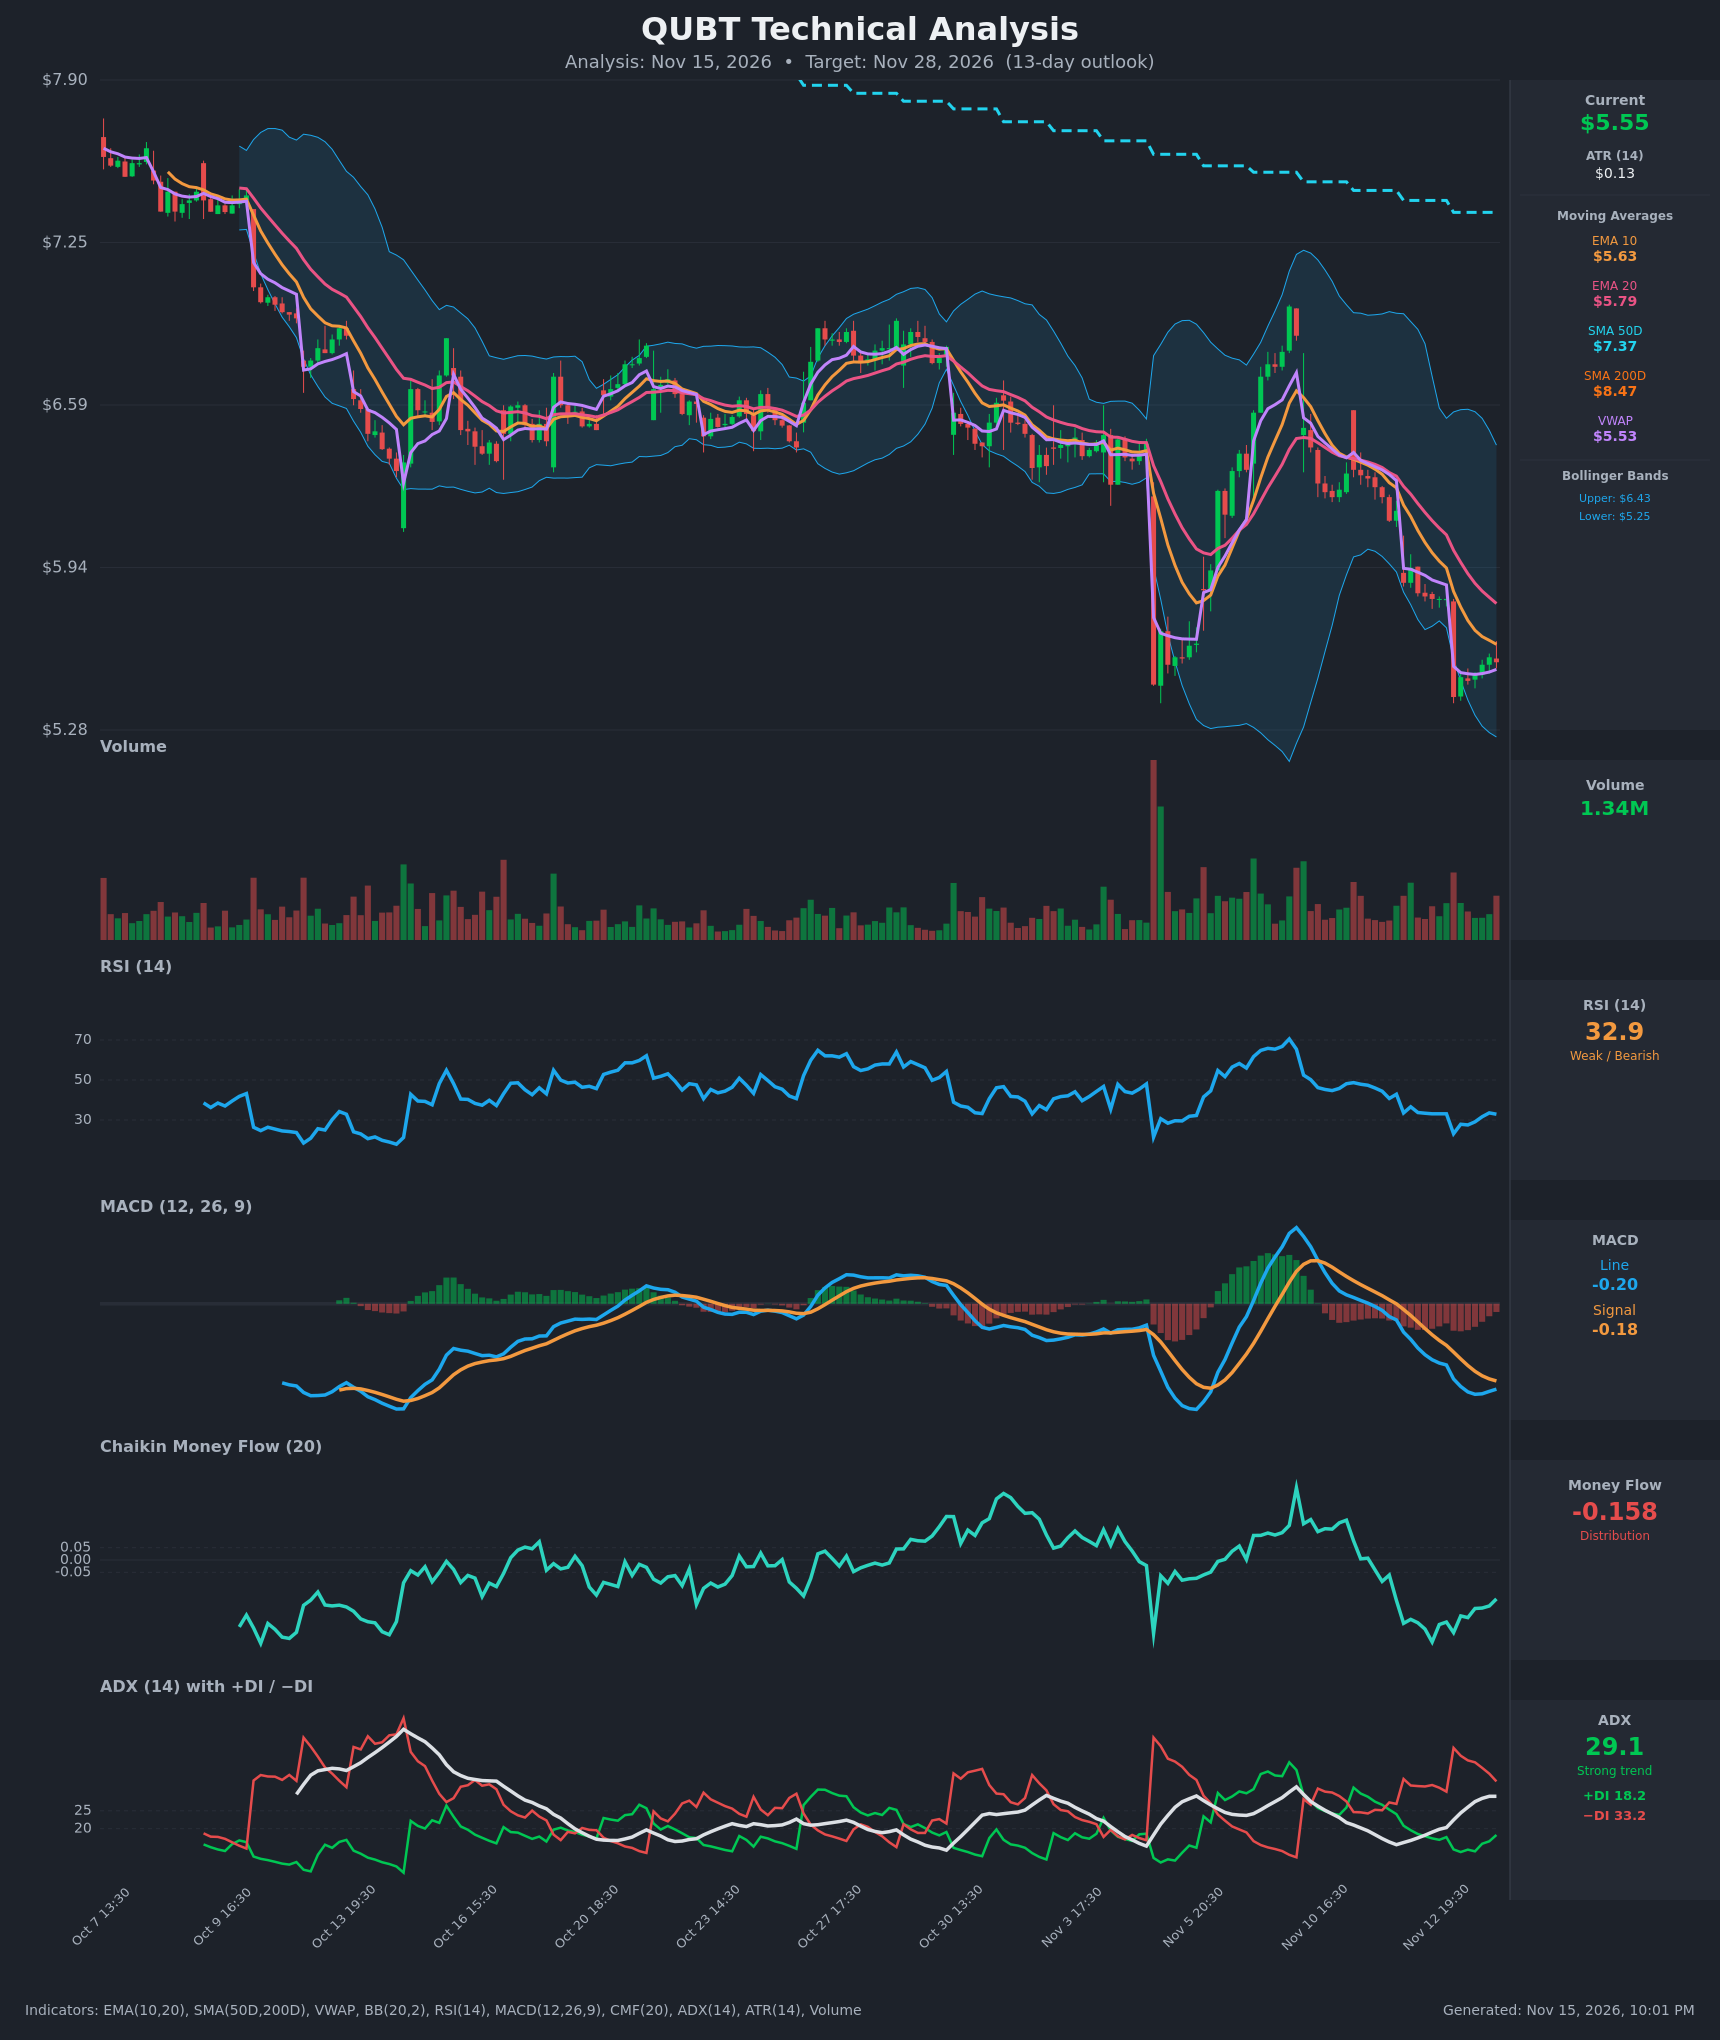
Analysis
TECHNICAL INDICATORS
- RSI (14): 32.89, just above the oversold line. It fell to 23.1 on Nov 13 and bounced only to the low 30s. Momentum is weak with no bullish divergence yet. [Bearish]
- 20 EMA: $5.7915, with price at $5.555 below it. EMA10 ($5.627) is under EMA20, so the bearish stack is intact and the 20 EMA is dynamic resistance. [Bearish]
- MACD: Line -0.2029 vs signal -0.1834. The line sits below the signal and both are well below zero. The line has been flattening since Nov 13 (-0.215 to -0.203), so the gap is narrowing and a bullish cross is possible, but none has occurred. [Bearish]
- Bollinger Bands (20): Upper $6.4295, lower $5.2541, with price in the lower third, about 0.26 of the band width. The bands are wide after the Nov 5 volatility, and price is hugging the lower band with no confirmed reversal. [Bearish]
- CMF (20): -0.158 is well below -0.05, so distribution persists. It has improved from -0.332 but remains negative. [Distribution]
- ADX (14): 29.1 and rising from 15-16, with −DI (33.2) well above +DI (18.2). This is an established, strong downtrend, though −DI is easing from 42.6 and the trend is maturing. [Strong Trend – Bearish]
- Volume: 1.34M, subdued relative to the big spike at the Nov 5 gap. Recent selling bars are not climactic, and the last few hourly bars show a small stabilization. That means a low-conviction bounce rather than capitulation. [Neutral to mildly Bearish]
DIVERGENCES & TRENDS
- Price made a lower low at $5.42 on Nov 13, and RSI is making higher lows from 23.1 to 32.9. This is an early, minor bullish momentum divergence on the intraday scale, but it is unconfirmed.
- The MACD histogram is shrinking (-0.015 → -0.020), showing decelerating downside momentum.
- Death cross: SMA50 ($7.37) is below SMA200 ($8.47), and price sits well below both, a long-term downtrend.
- The EMA10/EMA20 stack is bearish, and price is below VWAP's prior levels. Price is marginally above VWAP ($5.526) at $5.555, a slight intraday support.
- The lower-high sequence is clear: after the Nov 5–7 spike to about $7.0, price made lower highs and is now at new lows.
- CMF is recovering from -0.33 but is still deep in distribution.
CHART PATTERNS
- The broad structure since early October is a Bearish Descending Channel/Flag-type continuation, with a sharp drop, a bounce to about $7.0, and a failure to hold. This resembles the Bearish Flag/Descending Triangle continuation setup, with lower highs near $6.4–6.5 and breakdowns below $6.3 and $5.8.
- A Bullish Falling Wedge reversal on the hourly scale is possible if price keeps compressing near $5.3–5.5, but it is not confirmed.
- Measured-move logic: the prior breakdown from $6.4 to $5.5 is about $0.9, which would project toward $4.6–5.0 on continued failure below $5.40.
POTENTIAL SCENARIOS
- Scenario 1: Bearish Trend Continuation — The downtrend (ADX 29, −DI dominant, death cross) resumes. Price loses the Nov 13 low and slides along the lower Bollinger Band. Trigger: Hourly close below $5.40 with CMF staying below -0.10. Target: $5.00–5.15. Invalidation: Close above $5.80 (EMA20). (50% probability)
- Scenario 2: Neutral/Bullish Relief Bounce — Oversold RSI and a narrowing MACD gap produce a rebound toward the EMAs. Trigger: MACD bullish cross and a move above $5.65 on rising volume. Target: $5.80–6.00. Invalidation: Close below $5.35. (35% probability)
- Scenario 3: Neutral Basing Range — Price chops between $5.25 and $5.80 as the trend exhausts. Trigger: Low-ADX drift with price oscillating around VWAP. Target: $5.45–5.65. Invalidation: Break outside the range. (15% probability)
PRICE TARGETS
For 13 days, the range should be about 8–12% of price. ATR is $0.128 per hourly bar, and the trend is strongly down.
- Target Price: $5.28 (13-day)
- Expected Range: $4.85 to $5.85 ($1.00 width ≈ 18%, wide to reflect QUBT's high volatility; the downside is anchored by trend continuation)
- Key Levels: Support at $5.25, Resistance at $5.79
OVERALL BIAS
OVERALL BIAS: BEARISH - The strong ADX (29.1) with −DI far above +DI, price below all moving averages including a death-crossed SMA50/200, and CMF at -0.158 favor continued downside. The oversold RSI and shrinking MACD gap limit the pace of the decline and make a relief bounce a real risk.
This is educational analysis and not financial advice.