SLV 13-day neutral forecast — Nov 15, 2026
- Bias: Neutral
- Timeframe: 13 days (made Nov 15, 2026, target date Nov 27, 2026)
- Price at analysis: $44.12
- Price target: $42.90
- Expected range: $41.10 – $45.40
- Result: Pending — graded after the close on Nov 27, 2026
Get a free AI analysis of SLV today
Analysis
TECHNICAL INDICATORS
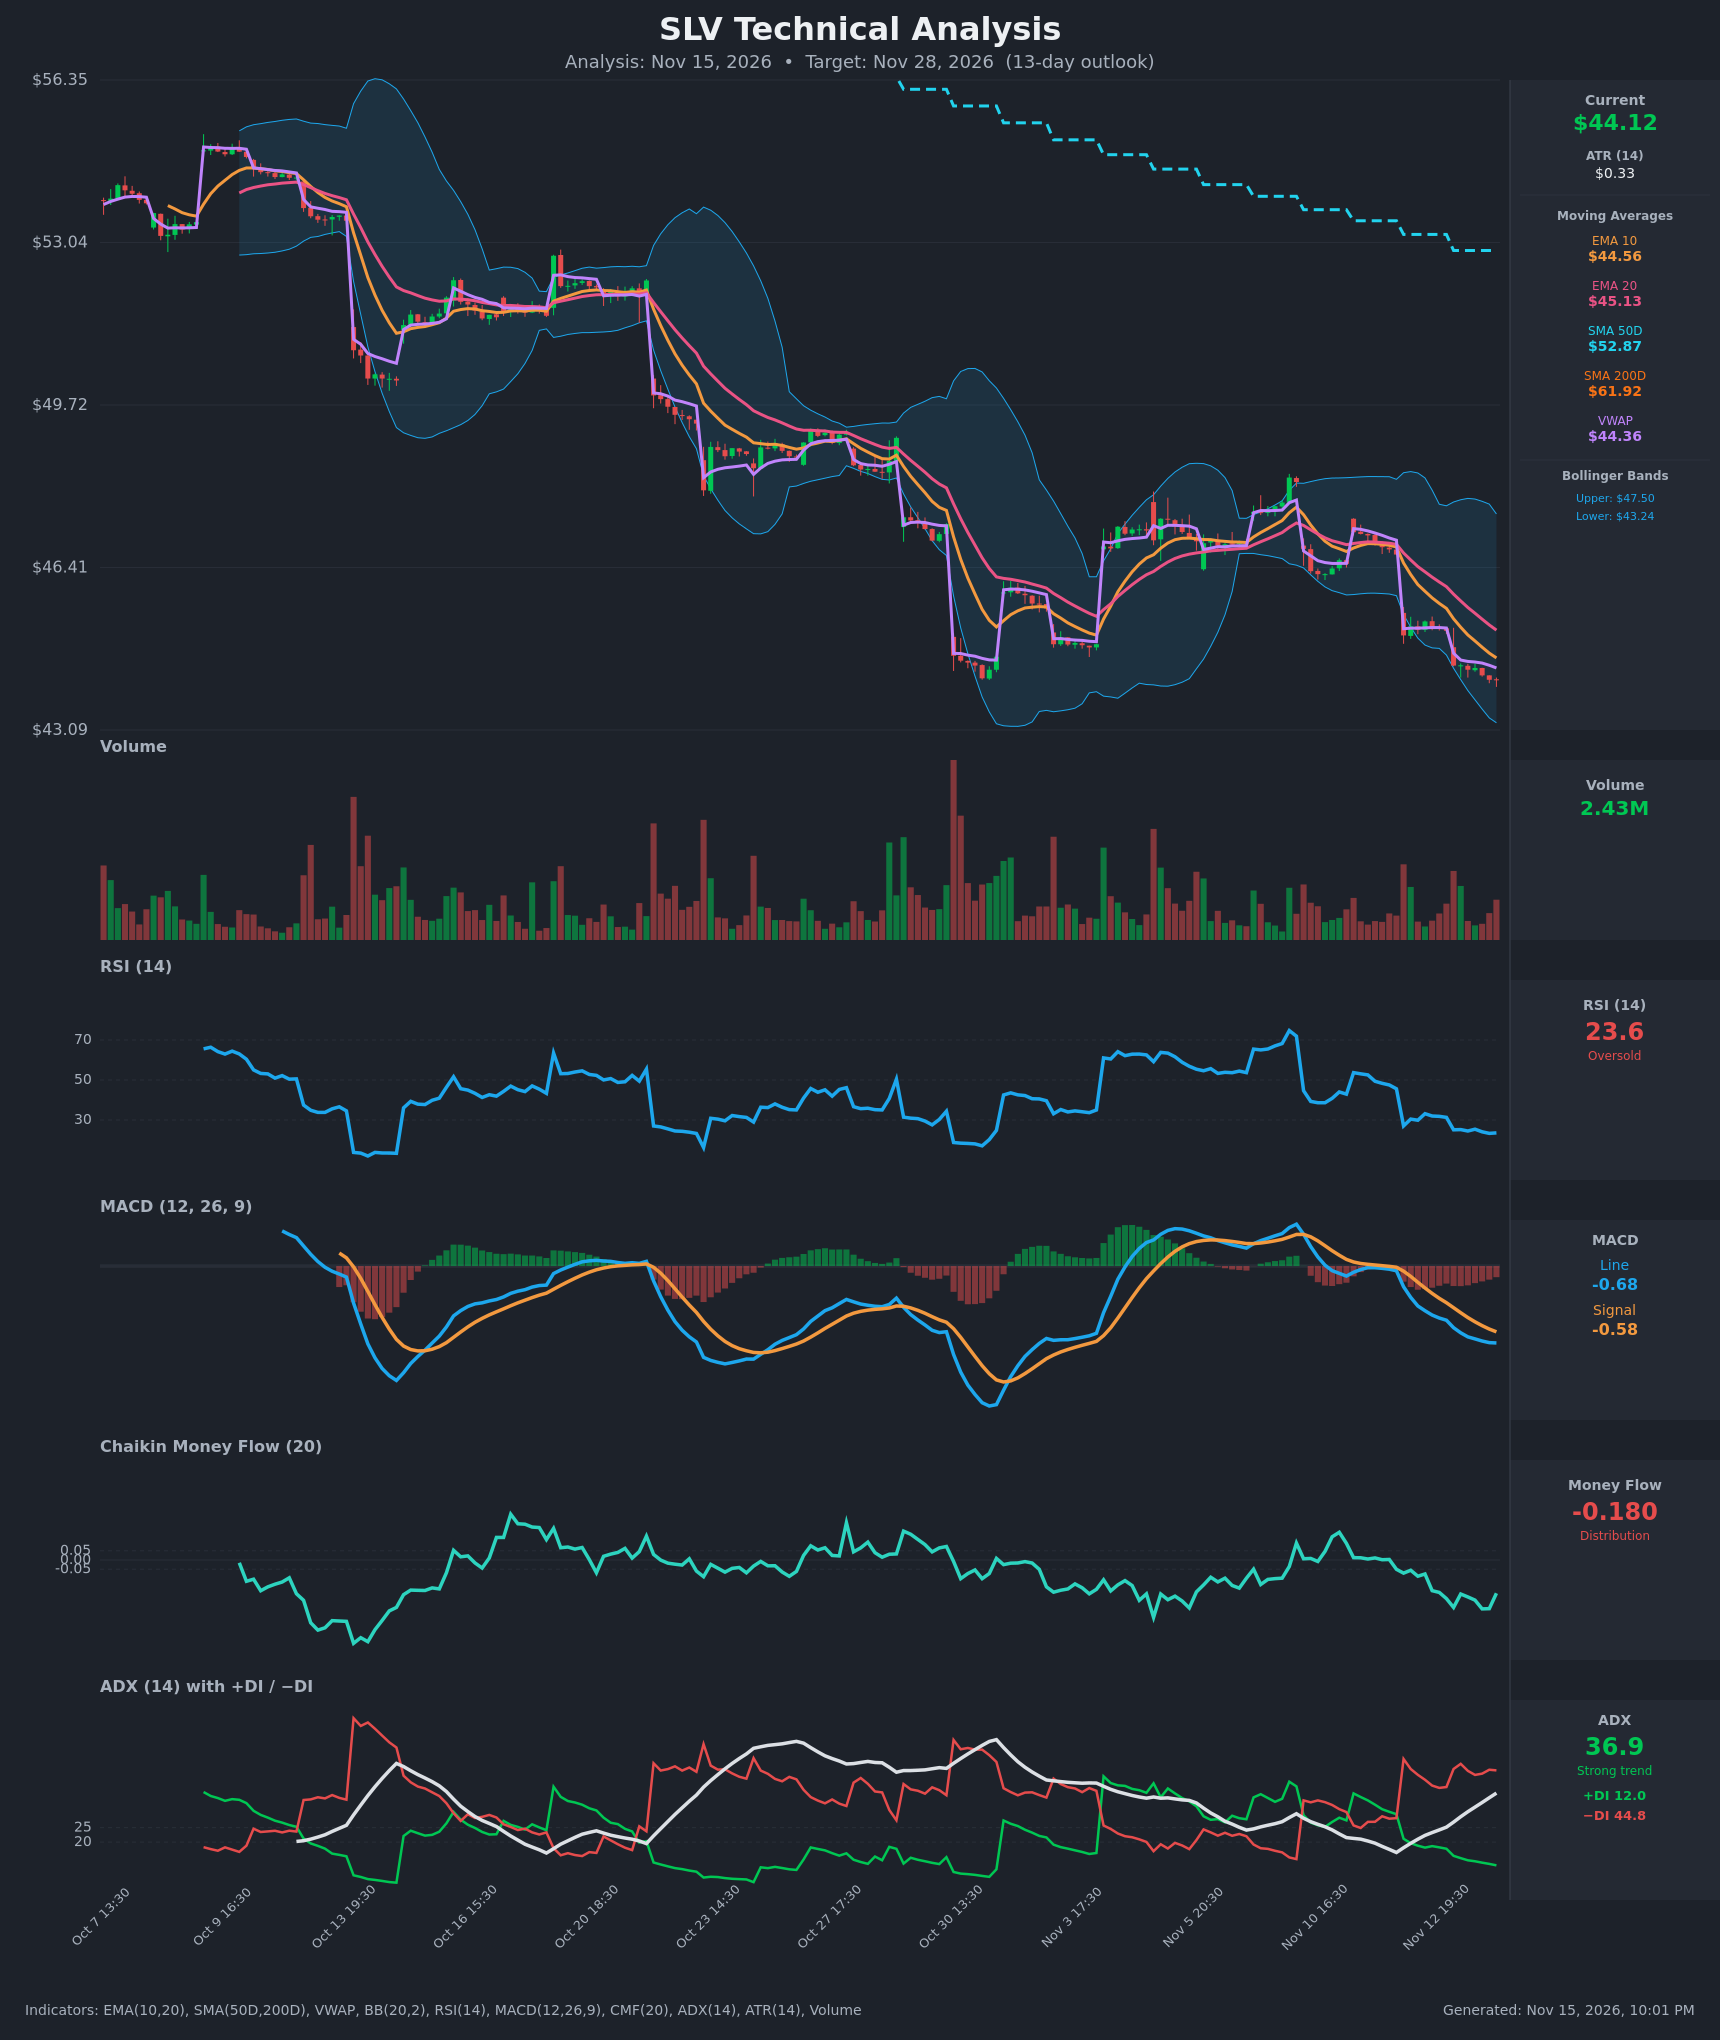
- RSI (14): 23.56, deeply oversold and sitting in the 23-33 zone for the last several sessions. It has made lower lows from 33.2 to 23.3 without a real bounce. Oversold supports a relief bounce, but RSI can stay pinned in a strong downtrend. [Bearish]
- 20 EMA: $45.13, with price ($44.12) about 2.2% below it. EMA10 ($44.56) is below EMA20 and both are sloping down, so the EMAs act as overhead resistance. [Bearish]
- MACD: Line -0.6835 is below Signal -0.5847, a histogram of about -0.10 that has been widening over the last several bars. This is a bearish crossover with momentum still expanding to the downside. [Bearish]
- Bollinger Bands (20): Upper $47.50, lower $43.24, with price near the lower band at $44.12. The bands are expanding and sloping down after a "walk" along the lower half. The bands remain wide, so volatility is elevated and a close below $43.24 would signal continuation. [Bearish]
- CMF (20): -0.180, well below the -0.05 threshold and mostly negative for the past week. That is persistent distribution, though it ticked up from -0.263. [Distribution]
- ADX (14): 36.9 and rising (from 16 to 37 in the last few sessions), with −DI at 44.8 far above +DI at 12.0. This is a strong, accelerating downtrend with bears in full control. [Strong Trend – Bearish]
- Volume: 2.43M, moderate and not a capitulation spike. Red bars were heavier on the breakdown legs (Oct 20-ish and Nov 12), while green bars are small. There is no volume washout yet, which suggests the selling may not be exhausted. [Mildly Bearish]
DIVERGENCES & TRENDS
- No bullish RSI or MACD divergence is visible. RSI is making new lows alongside price, so momentum confirms the decline.
- A prior oversold reading (RSI ~25 on Oct 13) only produced a modest bounce before the downtrend resumed.
- The MA stack is fully bearish: price ($44.12) < VWAP ($44.36) < EMA10 ($44.56) < EMA20 ($45.13) < SMA50 ($52.87) < SMA200 ($61.92). The death cross is already in place, and price is about 29% below the SMA200.
- The EMA10/EMA20 gap is widening (10 below 20 since Nov 11), and -DI crossed above +DI on Nov 12 and keeps widening.
- Price is below VWAP, so sellers hold the intraday and session edge.
- Peaks in price form a staircase of lower highs (about $54 → $51.5 → $48.5 → $47.5), with each bounce failing at the falling EMA20.
CHART PATTERNS
- The dominant structure is a descending channel / stair-step downtrend of lower highs and lower lows. The Nov 3-10 consolidation near $46.5-48 and its break lower resembles a Bearish Flag / Bearish Pennant continuation. Its measured move (the prior leg of about $1.5-2.5) points toward the low-$42s.
- A Bullish Falling Wedge could be forming, because the lower highs are converging with the lower lows. It is not confirmed, because there is no breakout above the upper trendline (roughly the EMA20 near $45.1) and no volume expansion. It is the main upside risk.
- There is no confirmed reversal pattern such as a double bottom, so the continuation structure takes priority.
POTENTIAL SCENARIOS
- Scenario 1: Bearish Trend Continuation — Strong ADX, −DI dominance, a widening MACD histogram and distribution on CMF favor further grinding lower, with only shallow rallies that fail at the EMAs. Trigger: a break and hourly close below $43.24 (lower BB) and $43.09. Target: $42.90 at the 13-day mark, with an extension to $41.50 to $42.00. Invalidation: a close above $45.13 (EMA20) with RSI above 40. (50% probability)
- Scenario 2: Bullish Oversold Relief Bounce — RSI at 23.6 and price at the lower Bollinger Band set up a mean-reversion rally toward the falling EMAs. This would likely be a counter-trend bounce within the larger downtrend. Trigger: reclaim of VWAP ($44.36) and EMA10 ($44.56) on rising volume. Target: $45.10 to $46.00, with a hard cap near the Bollinger midline/prior breakdown area of $46.4. Invalidation: rejection at $45.13 and a fall back below $44.00. (35% probability)
- Scenario 3: Neutral Base-Building — Price stalls between $43.1 and $45.1 as selling exhausts and the ADX rolls over. Trigger: lower-low failure with declining volume. Target: $43.8 to $44.6. Invalidation: a close outside $43.09 to $45.13. (15% probability)
PRICE TARGETS
- Target Price: $42.90 (13-day horizon, about -2.8% from $44.12)
- Expected Range: $41.10 to $45.40 (width $4.30, about 9.7% of current price, consistent with the 13-day timeframe guidance)
- Key Levels: Support at $43.09 (lower Bollinger Band and chart low area), Resistance at $45.13 (EMA20)
OVERALL BIAS
OVERALL BIAS: BULLISH is not warranted here.
OVERALL BIAS: BEARISH - Price is below every moving average with a widening bearish MACD, −DI (44.8) far above +DI (12.0), ADX at 36.9 and rising, and persistent CMF distribution. The oversold RSI (23.6) raises the odds of a bounce, but with no volume capitulation or divergence the trend favors lower prices.
This is educational analysis and not financial advice.