QCOM 20-day bullish forecast — Nov 15, 2026
- Bias: Bullish
- Timeframe: 20 days (made Nov 15, 2026, target date Dec 4, 2026)
- Price at analysis: $172.47
- Price target: $177.50
- Expected range: $165.50 – $186.00
- Result: Pending — graded after the close on Dec 4, 2026
Get a free AI analysis of QCOM today
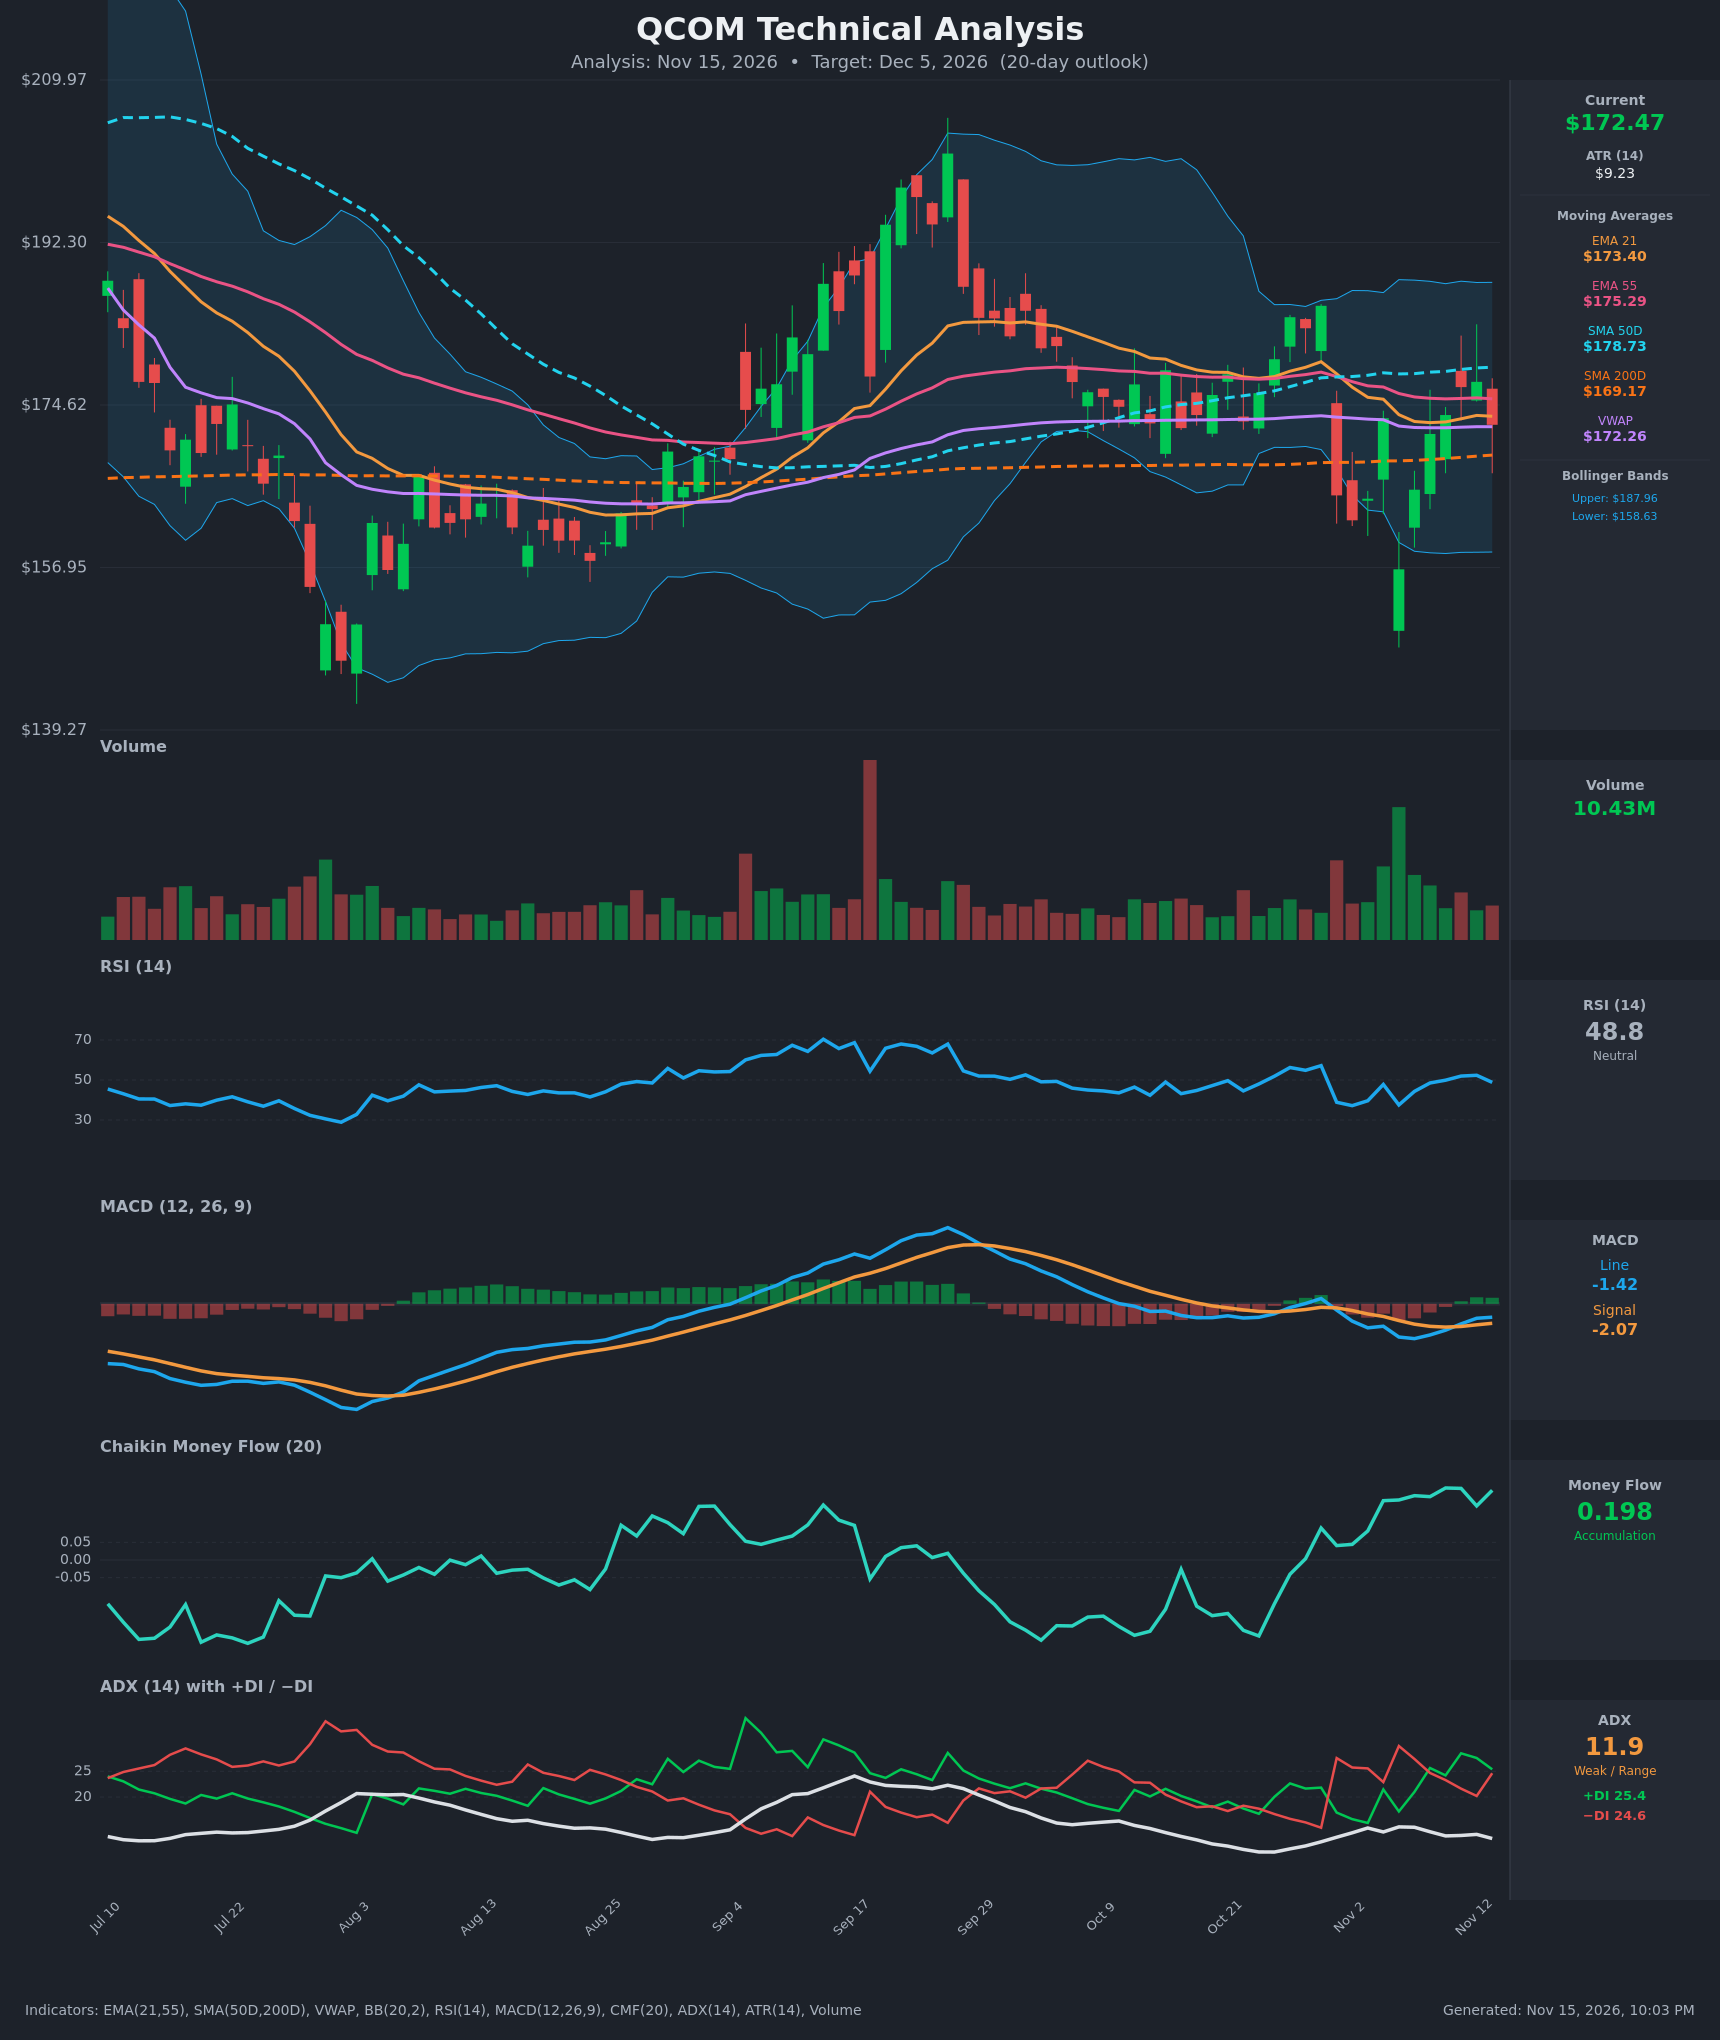
Analysis
TECHNICAL INDICATORS
- RSI (14): 48.82, almost exactly at the 50 midline. It has recovered from 37.5 on Nov 5 and peaked near 52.4 on Nov 12 before easing. Momentum is neutral with a slight upward bias off the lows. [Neutral]
- 20 EMA (EMA 21): $173.40. Price at $172.47 is just below it, so the EMA acts as near-term resistance. EMA21 is also below EMA55 ($175.29), a mild short-term bearish alignment. The gap is narrow. [Bearish]
- MACD: Line -1.42 versus signal -2.07, so the histogram is positive (+0.65). The bullish crossover happened around Nov 11, but both lines are still below zero. The line is rising while the signal flattens, so momentum is improving off a low base. [Bullish]
- Bollinger Bands (20): Upper $187.96, lower $158.63, midline about $173.30. Price sits right on the midline, so there is no overbought or oversold signal. The bands are wide, reflecting high recent volatility (ATR $9.23), and are not squeezing. [Neutral]
- CMF (20): 0.198, well above the +0.05 threshold and the highest of the visible period. It has been positive for 10+ sessions and rising since late October. Buying pressure and accumulation are persistent even though price has been choppy. [Accumulation]
- ADX (14): 11.9, well below 20, so there is no meaningful trend. +DI (25.4) is only marginally above −DI (24.6), so neither side is in control. This favors range behavior. [Weak Trend – no clear direction]
- Volume: 10.43M, average to slightly below average. The largest recent volume came on the late-October selloff and the rebound off the low. The latest candle is a red bar on ordinary volume, which does not confirm a breakout in either direction. [Neutral]
DIVERGENCES & TRENDS
- CMF vs. price: CMF is making new highs for the period (0.198) while price is still below the 21/55 EMAs and the 50-day SMA. This is a mild bullish divergence, suggesting dip buying and accumulation on the Oct 30–Nov 5 selloff.
- MACD: A bullish crossover is in place (Nov 11), but the line is still negative. A move above zero would need price to push toward $178+.
- Moving averages:
- The 21 EMA remains below the 55 EMA, and the 50-day SMA ($178.73) is above price. These form an overhead resistance stack at $173.40, $175.29 and $178.73.
- The 50-day SMA is above the 200-day SMA ($169.17), so the long-term structure is a golden-cross uptrend.
- Price is above the 200-day SMA, which keeps the long-term bias constructive and gives support just under price.
- DI lines: +DI and −DI have repeatedly crossed (Nov 4, Nov 5, Nov 9) and are nearly equal now. This is a classic whipsaw environment with low ADX.
- Price action: Price is oscillating around VWAP ($172.26) and the 21 EMA. The Oct 30 gap down (-11%) found support at $156–162, and the bounce has retraced about two-thirds of the drop.
CHART PATTERNS
- Broad consolidation/range: Since late September, price has traded between roughly $157 and $186 and is now mid-range. It most resembles the diagram's Bullish Triple Top/Bottom range structure, with a floor near $157–162 and a ceiling near $185.
- Developing Bullish Double Bottom (tentative): The Nov 2–5 lows ($156.75–$162) are a reasonably tested floor, and price has bounced back above $170. Neckline resistance is roughly $184–185 (the Oct 27–29 highs). A confirmed break above the neckline would imply a target of about $195+. That is outside the 20-day range, so I give it only partial weight.
- No confirmed breakout: Neither a clean reversal nor a continuation pattern is confirmed. The key lines are the 200-day SMA at $169 on the downside and the 50-day SMA at $178.73 on the upside.
POTENTIAL SCENARIOS
- Scenario 1: Bullish Accumulation Breakout Toward the 50-Day SMA and Beyond — CMF accumulation and the MACD crossover support a grind higher as price reclaims the 21/55 EMAs and the 50-day SMA. Trigger: daily close above $175.30 (EMA55), then $178.73 (SMA50). Target: $178–$185 (upper Bollinger band near $188 as an extension). Invalidation: daily close below $169 (SMA200). (45% probability)
- Scenario 2: Neutral Range Chop — With ADX under 12, price keeps whipsawing around VWAP and the 21 EMA, bounded by the 200-day SMA and the 50-day SMA. Trigger: repeated failures at $178–$179 and buying at $166–$169. Target: $166–$179 range. Invalidation: close outside $165 or $180. (28% probability)
- Scenario 3: Bearish Rejection and Retest of Lows — Price is rejected at the overhead EMAs and loses the 200-day SMA, and MACD rolls back over. Trigger: close below $169.17 on rising volume, with −DI retaking control. Target: $158–$162 (lower Bollinger band $158.63, Nov lows near $156.75). Invalidation: reclaim of $175.30. (27% probability)
PRICE TARGETS
Self-check: range width is $186.00 − $165.50 = $20.50, which is 11.9% of $172.47. That fits the 8–12% guidance for 14–21 days, and the width is larger than a 2–3 day range would be.
- Target Price: $177.50 (20-day target, about +2.9%, near the 50-day SMA)
- Expected Range: $165.50 to $186.00
- Key Levels: Support at $169.17 (200-day SMA), Resistance at $178.73 (50-day SMA)
OVERALL BIAS
OVERALL BIAS: BULLISH - CMF shows strong accumulation (0.198) and a MACD bullish crossover is in place, with price holding above the rising 200-day SMA. The main caveats are the stacked overhead moving averages at $173–$179 and a very weak ADX (11.9), so conviction is modest and the move is likely to be choppy.
This is educational analysis and not financial advice.