QCOM 34-day bullish forecast — Nov 15, 2026
- Bias: Bullish
- Timeframe: 34 days (made Nov 15, 2026, target date Dec 18, 2026)
- Price at analysis: $172.47
- Price target: $179.50
- Expected range: $162.00 – $188.00
- Result: Pending — graded after the close on Dec 18, 2026
Get a free AI analysis of QCOM today
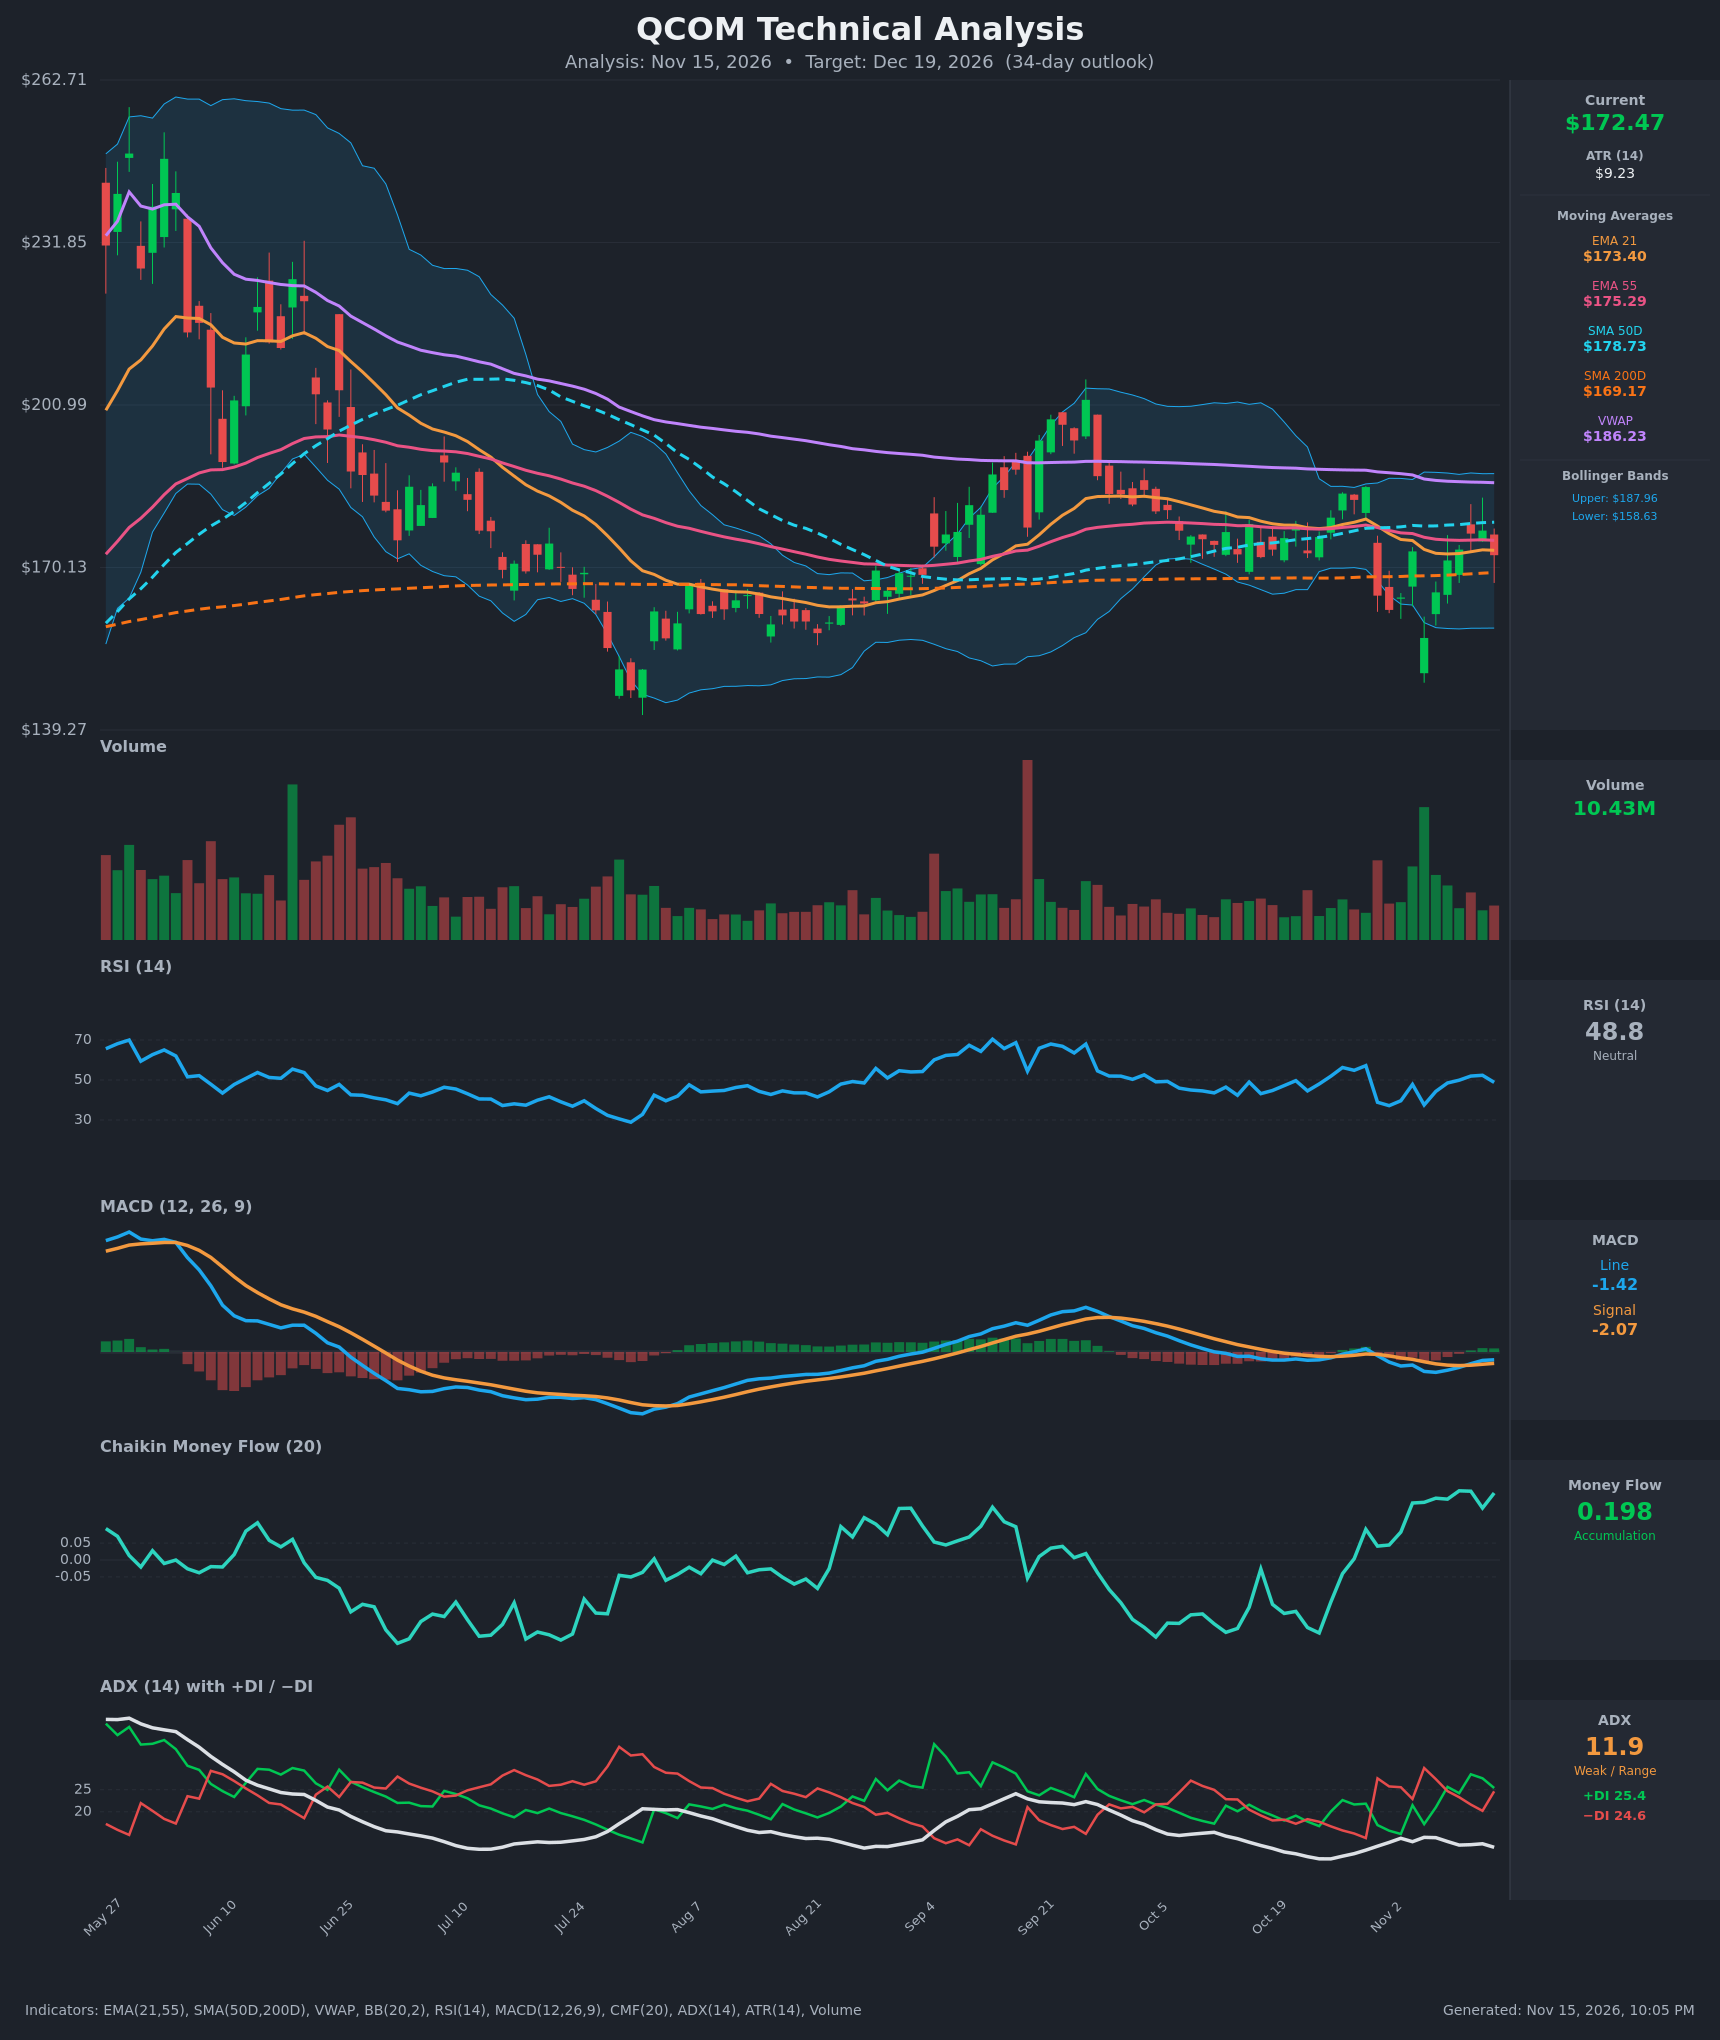
Analysis
TECHNICAL INDICATORS
- RSI (14): 48.8, neutral and mid-range. It has recovered from 37.5 on Nov 5 and rolled over slightly from 52.4. Momentum is neutral, with a mild upward bias from the recent low. [Neutral]
- 20 EMA: The 21 EMA is $173.40 and price ($172.47) is just below it, with the 55 EMA at $175.29 above that. Price is below both, so they act as near-term resistance. The 21 EMA is flattening and starting to curl up from $172.70. [Bearish]
- MACD: Line -1.42 is above signal -2.07, a bullish crossover that occurred around Nov 11. The histogram is positive and rising, but both lines are still below zero, so the crossover is early and lacks confirmation. [Bullish]
- Bollinger Bands (20): Upper $187.96, lower $158.63, so the bands are wide (about $29). Price sits slightly below the midline (~$173.30), which is neutral. The Nov 5 low pierced the lower band and was bought, and there is no squeeze. [Neutral]
- CMF (20): 0.198, well above +0.05 and near its highest level in the visible window. Accumulation has risen steadily during the Nov selloff while price made lows. [Accumulation]
- ADX (14): 11.9, which is weak and range-bound, and it is falling. +DI 25.4 is marginally above −DI 24.6, so the DIs are nearly tied and there is no directional control. [Weak Trend, no clear direction]
- Volume: 10.43M, below the recent spike days (the Oct 30 gap down and the Nov 5 selloff). Declining volume on the bounce suggests selling pressure is fading, but there is no breakout participation yet. [Neutral]
DIVERGENCES & TRENDS
- Bullish CMF divergence: Price made a lower low on Nov 5 ($156.75, close $156.75 vs. ~$164 on Oct 30) while CMF rose from about 0.04 to about 0.20. Buyers were absorbing supply into weakness.
- MACD: It crossed above its signal on Nov 11-13 from deeply negative levels, which is an early momentum improvement. The line is still below zero.
- Moving averages: The SMA50D ($178.73) is above the SMA200D ($169.17), so there is no death cross and the longer-term structure stays intact. Price is above the SMA200D (long-term support) but below the EMA21, EMA55, SMA50D and VWAP ($186.23). The EMA21 is below the EMA55, a mild short-term bearish stack.
- VWAP: Price is about 7% below VWAP, which signals a lack of buyer control over the long horizon. It also leaves room for mean-reversion upside.
- DI and ADX: The +DI/−DI lines have crossed back and forth. ADX near 12 confirms a trendless market.
CHART PATTERNS
- Rectangle/range: Price has traded between about $156 and $187 since September, with the SMA200D ($169) acting as a pivot. It resembles the Bullish Triple Top range structure in the reference diagram, and ADX confirms the sideways behavior.
- Possible double bottom: The $162 (Nov 2) and $156.75 (Nov 5) lows may form a tentative Bullish Double Bottom. The neckline is near $177-178, which coincides with the Nov 12 high and the SMA50D. A close above ~$178.70 would target roughly $178.70 + ($178.70 - $157) ≈ $200 in theory, but I treat only part of that as realistic for 34 days, given resistance at the BB upper band/VWAP (~$186-188).
- Failure risk: A failure at $178 and a break below $169 (SMA200D) would turn the range into a bearish rejection, with a retest of $156-158.
POTENTIAL SCENARIOS
- Scenario 1: Bullish Range Breakout Toward VWAP — CMF accumulation, the MACD crossover and the double-bottom structure support a push through the SMA50D. Trigger: daily close above $178.73 (SMA50D/neckline) with volume above ~12M. Target: $186-188 (VWAP/upper Bollinger Band), with $179.50 as the 34-day central target. Invalidation: daily close below $169.17 (SMA200D). (45% probability)
- Scenario 2: Neutral Range Chop — Weak ADX keeps price oscillating around the EMAs between the SMA200D and SMA50D. Trigger: repeated failures at $178-179 and bounces at $169-170. Target: $168-$178. Invalidation: a close outside that band on volume. (33% probability)
- Scenario 3: Bearish Breakdown — The rally stalls at the EMAs/SMA50D, and a loss of the SMA200D opens a retest of the November lows. Trigger: close below $169.17, then below $162. Target: $156-$158 (lower Bollinger Band area). Invalidation: close above $178.73. (22% probability)
PRICE TARGETS
- Target Price: $179.50 (34-day)
- Expected Range: $162.00 to $188.00 (width $26.00 ≈ 15.1% of current price, consistent with the 30-60 day guidance of 12-18%)
- Key Levels: Support at $169.17 (SMA200D), Resistance at $178.73 (SMA50D)
OVERALL BIAS
OVERALL BIAS: BULLISH - CMF accumulation (0.198) with a bullish divergence versus the November low, a fresh MACD bullish crossover, price holding the SMA200D, and a possible double bottom point to a modest upward drift. ADX is weak and price is still below the EMAs and SMA50D, so conviction is modest.
This is educational analysis and not financial advice.