QCOM 62-day bullish forecast — Nov 15, 2026
- Bias: Bullish
- Timeframe: 62 days (made Nov 15, 2026, target date Jan 15, 2027)
- Price at analysis: $172.47
- Price target: $181.00
- Expected range: $156.00 – $196.00
- Result: Pending — graded after the close on Jan 15, 2027
Get a free AI analysis of QCOM today
Analysis
TECHNICAL INDICATORS
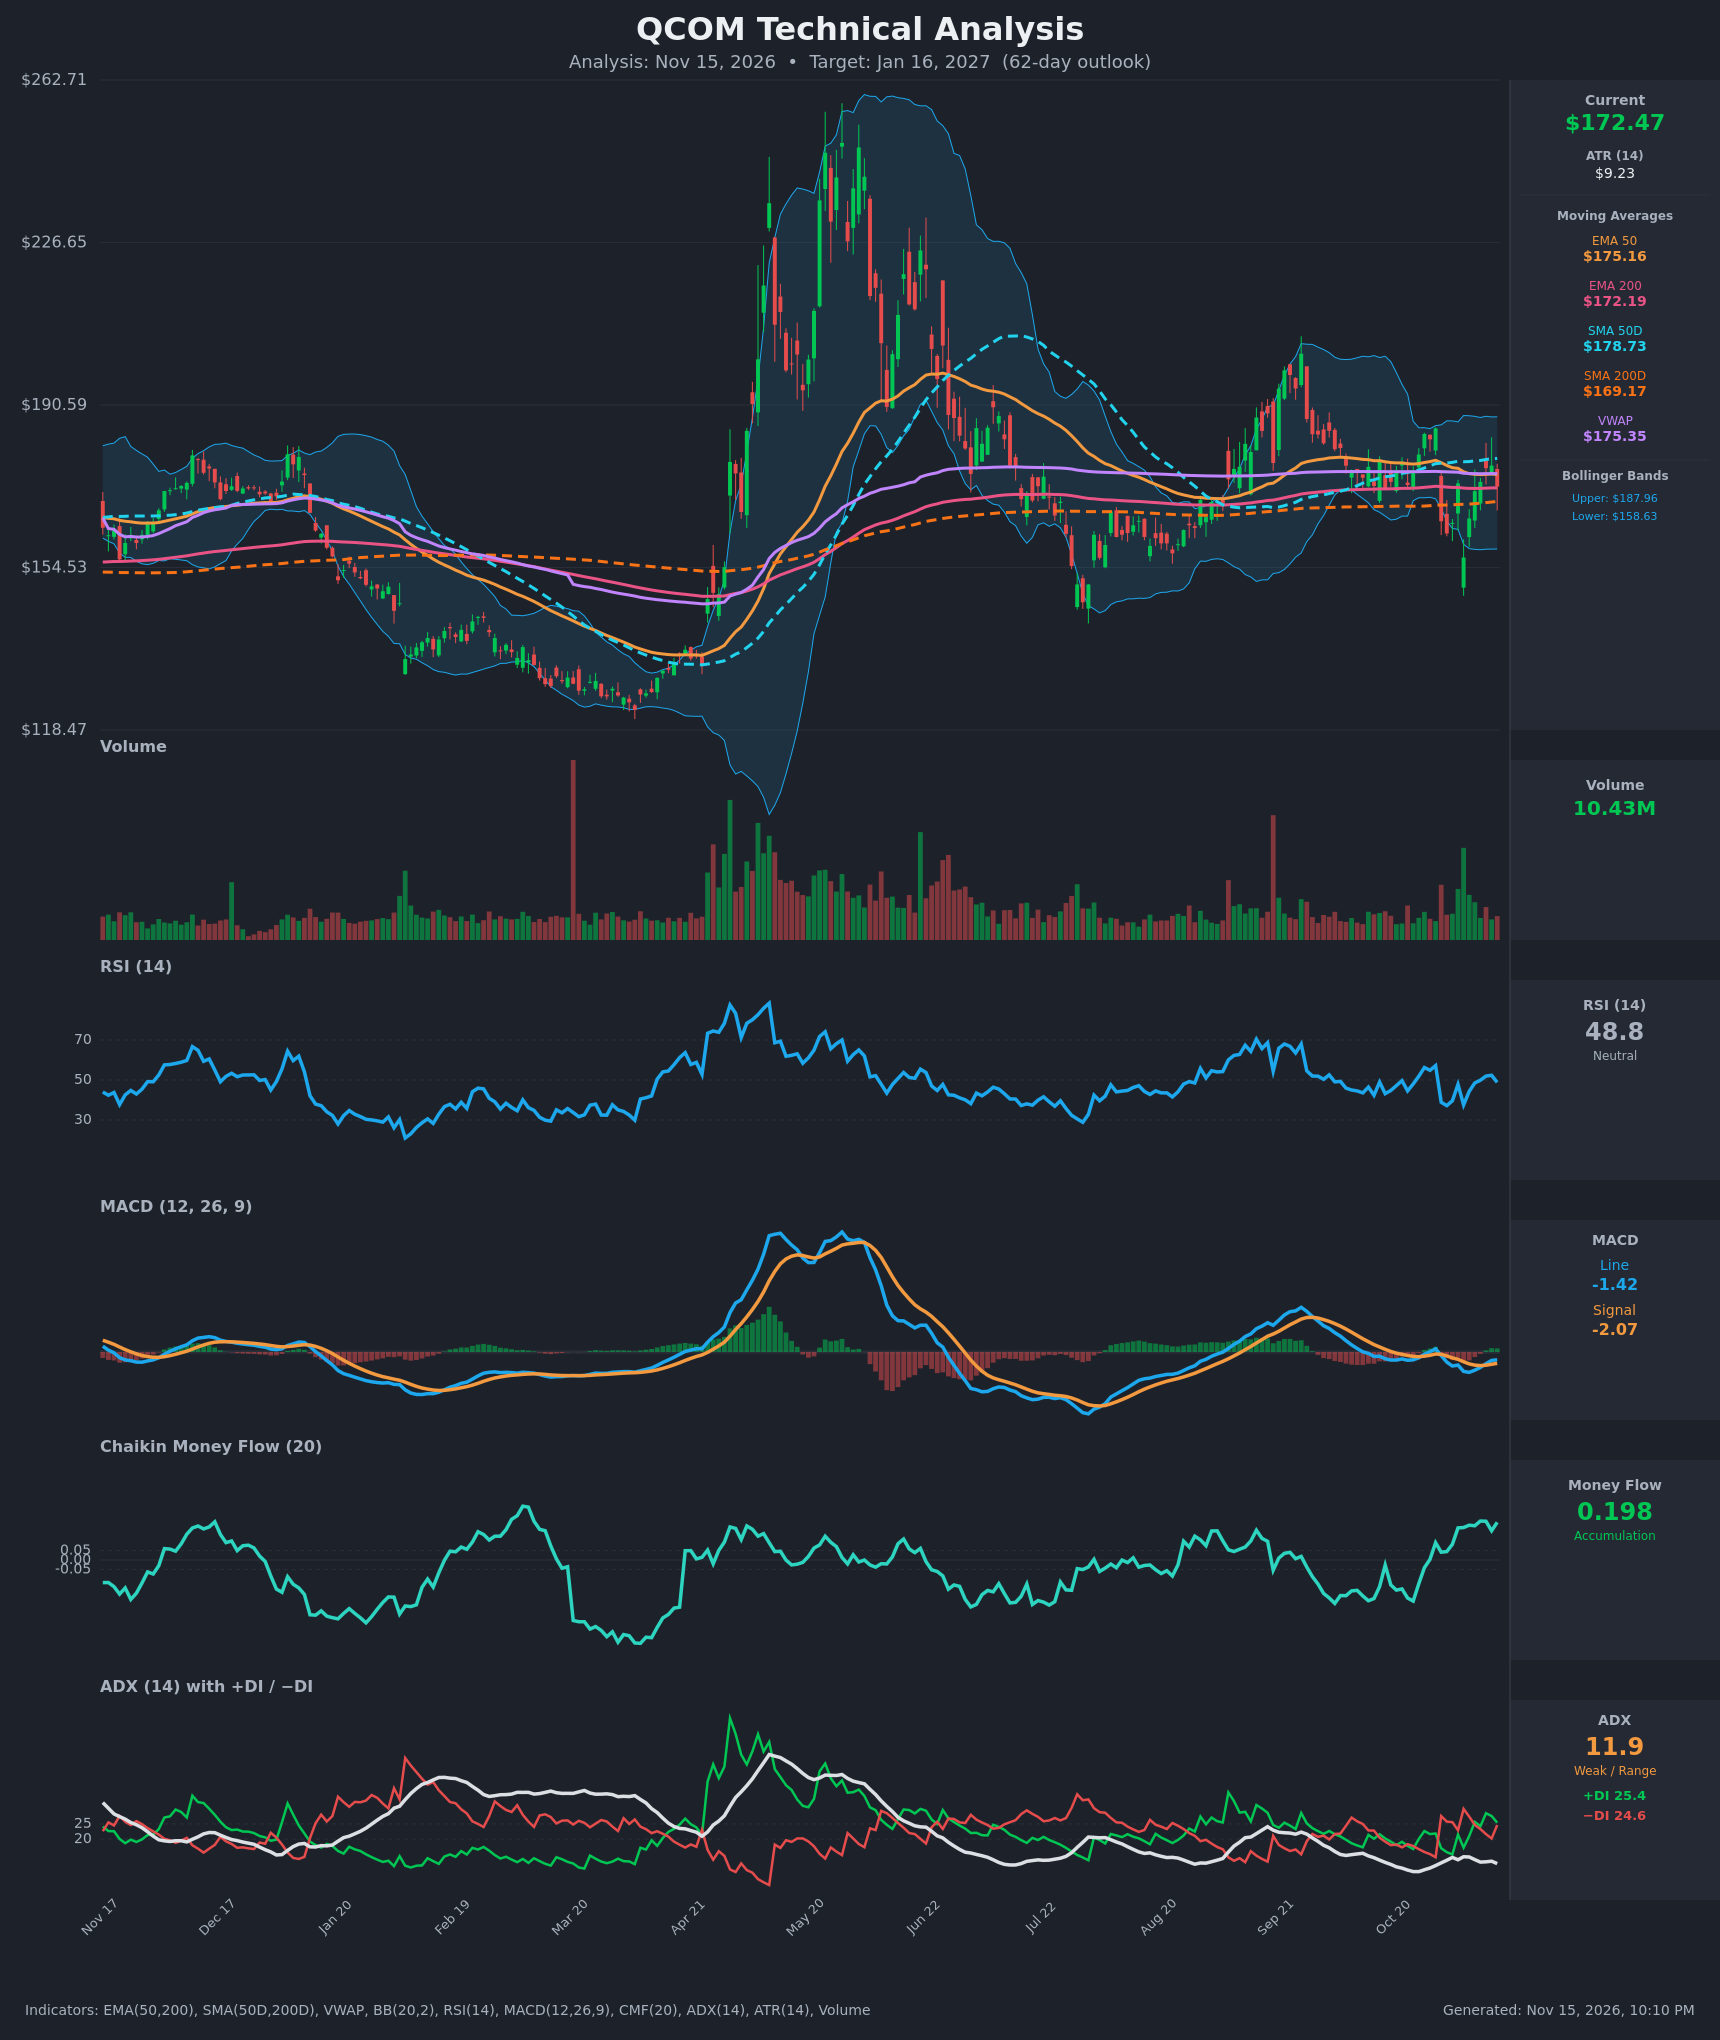
- RSI (14): 48.82, neutral and mid-range. It has recovered from 37.5 on Nov 5 but just ticked down from 52.4 on Nov 12. Momentum is stable with no overbought or oversold pressure. [Neutral]
- 20 EMA: The 20 EMA was not supplied, so I used the EMA 50 as the nearest proxy. Price ($172.47) sits just below EMA 50 ($175.16), which is minor overhead resistance. It is just above EMA 200 ($172.19), which acts as thin support. EMA 50 is 2.97 above EMA 200 and has been flattening. [Neutral]
- MACD: Line -1.42 is above signal -2.07, a positive histogram of about +0.65. The line crossed back above the signal on Nov 11 and the histogram has turned positive after bottoming near -3.7. Both lines are still below zero, so this is an early recovery, not a confirmed trend. [Bullish]
- Bollinger Bands (20): Upper $187.96, lower $158.63, so the middle is about $173.30 and price sits right at the midline. The bands are moderately wide (about 17% of price) after the earnings-driven swings. The Nov 5 low of $156.75 pierced the lower band and was rejected. [Neutral]
- CMF (20): 0.198, well above +0.05 and the highest in months. It has stayed positive for the last 10+ sessions while price chopped sideways, which points to accumulation on dips. [Accumulation]
- ADX (14): 11.9, very weak and range-bound. +DI 25.4 is barely above −DI 24.6, and the DIs have been crossing back and forth. There is no directional trend. [Weak Trend, no clear direction]
- Volume: 10.43M, around average. The Oct 30 and Nov 5 selloffs came on elevated volume but were absorbed, with the rebound bars also showing decent volume. No climactic distribution is visible. [Neutral to mildly supportive]
DIVERGENCES & TRENDS
- Money flow vs price: CMF is making higher readings (0.198) while price is flat to lower than late October ($185 down to $172). This is a mild bullish divergence, with buyers absorbing supply.
- RSI and MACD: Both made higher lows from the Nov 5 trough ($156.75), and price recovered about $16. This is a short-term improvement in momentum.
- Moving averages: SMA50D ($178.73) is above SMA200D ($169.17), so the golden cross is intact. The SMA50D has been rising slowly. Price is still above SMA200D (long-term support) but below SMA50D, EMA50 and VWAP ($175.35), which form a resistance cluster at $175-179.
- Longer trend: The big April-May spike to about $260 has fully retraced. Since June, price has ranged roughly $140-$205, then tightened to about $155-$187. The 200-day averages are flat to rising and converge with price.
- Crossovers: MACD turned up through its signal on Nov 11. +DI/−DI is flipping with no sustained lead. There is no EMA or SMA crossover pending.
CHART PATTERNS
- Rectangle/range with a double-bottom flavor: Price has bounced twice from about $155-$158 (Nov 5 low, and the late-summer/October lows) and been rejected near $185-$188. This loosely resembles the Bullish Double Bottom / Triple Top range in the reference diagram. A close above the $185-$188 neckline projects a measured move of about +$28, to roughly $213. A close below $155 would invalidate the base and target about $140.
- Symmetrical triangle tendencies: The narrowing swings since September (lower highs near $185 against a rising 200-day base) hint at a Symmetrical Triangle. That pattern can break either way, and the weak ADX fits the compression.
- No complete reversal pattern such as a head and shoulders is visible on the recent leg, so the base case is a range with a modest upward tilt from accumulation.
POTENTIAL SCENARIOS
- Scenario 1: Bullish Range Breakout Attempt — Accumulation (CMF 0.198) and a positive MACD turn lift price through the $175-$179 resistance cluster, with a retest of the upper band. Trigger: daily close above $179 (SMA50D), then above $185.5. Target: $185-$195, with a stretch toward $200+ if $188 breaks with volume. Invalidation: close below $169 (SMA200D) and then below $162. (45% probability)
- Scenario 2: Neutral Range Chop — ADX stays below 20 and price oscillates between the 200-day averages (about $169-$172) and the 50-day cluster ($175-$179). Trigger: repeated failures at $179 and bounces at $169. Target: $166-$178. Invalidation: close outside $158-$188 on volume. (30% probability)
- Scenario 3: Bearish Breakdown — Price loses the 200-day cluster and revisits the Nov 5 low. Trigger: daily close below $169, then below $162 with MACD rolling over. Target: $156-$158, then about $148. Invalidation: reclaim of $176-$179. (25% probability)
PRICE TARGETS
- Target Price: $181.00 (62-day, to about Jan 16, 2027)
- Expected Range: $156.00 to $196.00. Width is $40, or about 23.2% of the current price, which fits the 61-180 day guidance of 18-30%.
- Key Levels: Support at $169.17 (SMA200D), Resistance at $185.50 (late-October highs, just under the upper Bollinger Band at $187.96)
OVERALL BIAS
OVERALL BIAS: BULLISH - Strong CMF accumulation (0.198), a fresh MACD bullish crossover, price holding above the 200-day averages with the golden cross intact, and higher RSI/MACD lows after the Nov 5 flush favor a modest upward drift. Conviction is moderate because ADX is very weak and price must clear the $175-$179 resistance cluster.
This is educational analysis and not financial advice.