QCOM 27-day bullish forecast — Nov 15, 2026
- Bias: Bullish
- Timeframe: 27 days (made Nov 15, 2026, target date Dec 11, 2026)
- Price at analysis: $172.47
- Price target: $177.50
- Expected range: $162.00 – $187.00
- Result: Pending — graded after the close on Dec 11, 2026
Get a free AI analysis of QCOM today
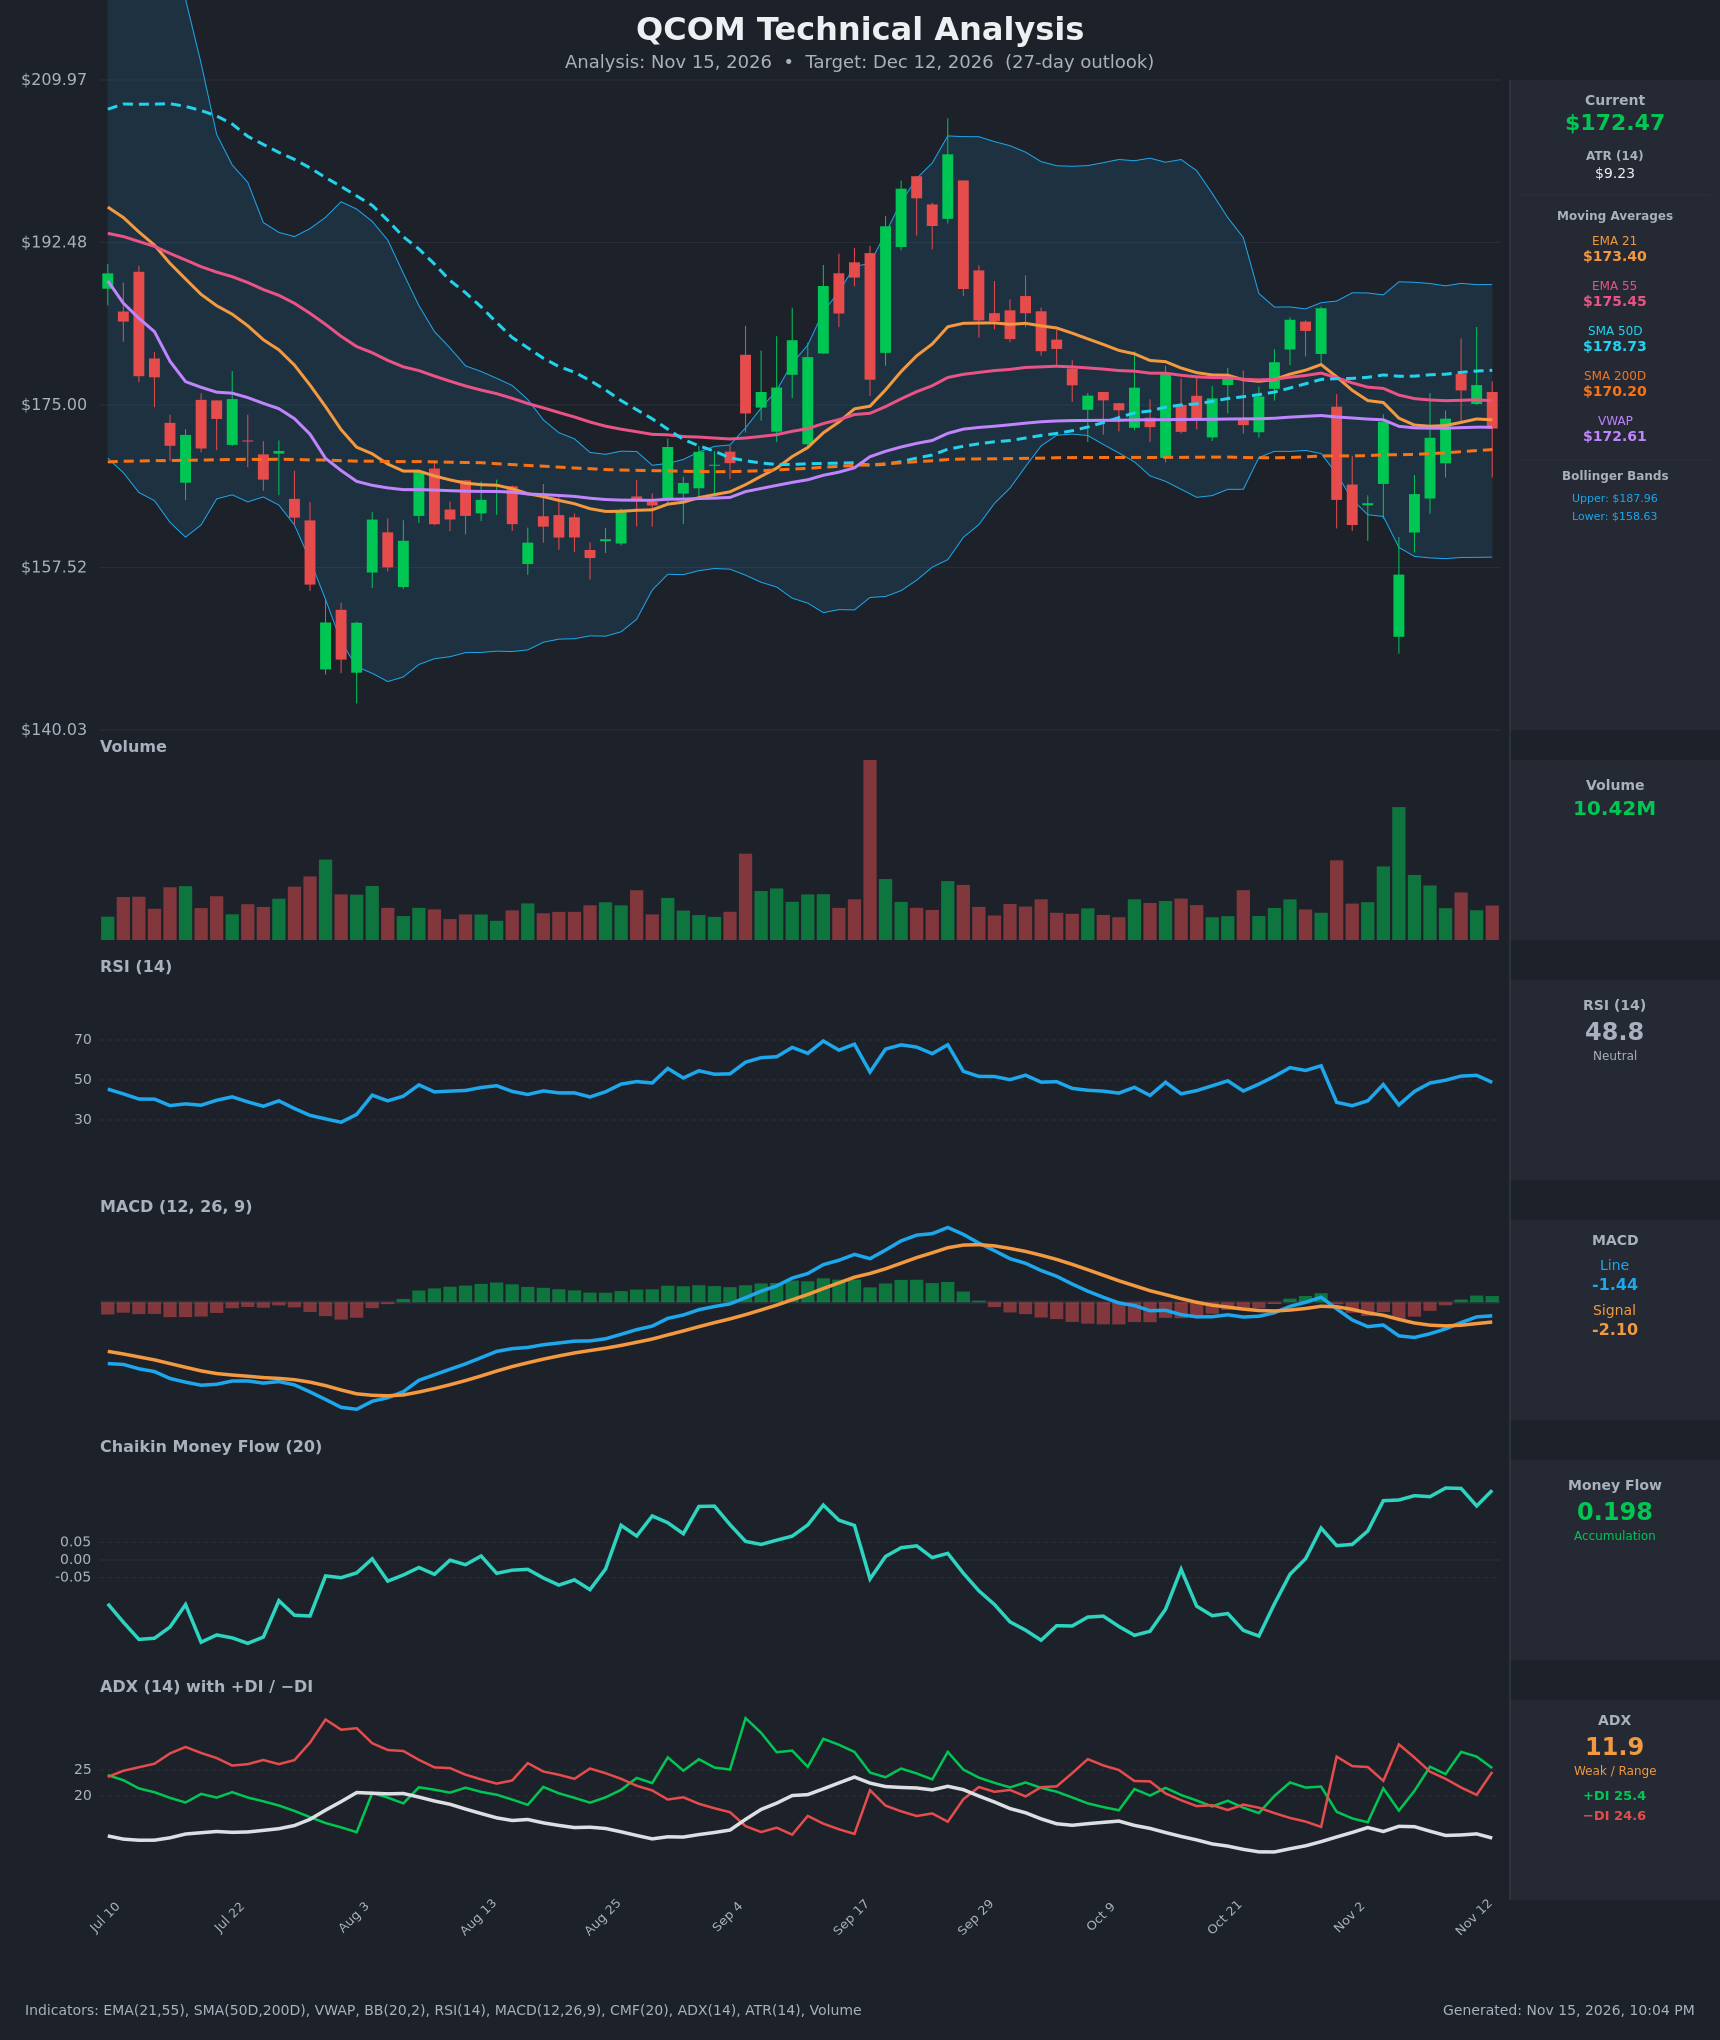
Analysis
TECHNICAL INDICATORS
- RSI (14): 48.8, sitting right at the midline. It dipped to about 37 on Nov 5 and has recovered to the 50s before easing back today. Momentum is stabilizing but not yet decisive. [Neutral]
- 20 EMA: EMA21 is $173.40 and price ($172.47) is just under it, so it acts as minor resistance. EMA21 sits below EMA55 ($175.45), and the 50-day SMA ($178.73) is the next overhead hurdle. Price is near VWAP ($172.61) and above the SMA200 ($170.20). [Neutral]
- MACD: The line (-1.44) is above the signal (-2.10) after a bullish crossover around Nov 10, and the histogram is slightly positive and rising. Both lines are still below zero, so this is a recovery in momentum, not a confirmed uptrend. [Bullish]
- Bollinger Bands (20): The bands are $158.63 to $187.96, with price slightly below the midline (about $173). The bands are wide after the Oct 30 and Nov 5 volatility, and price is mid-band with no squeeze or breakout. [Neutral]
- CMF (20): 0.198, well above the +0.05 threshold. It has risen steadily from negative in late October to its highest level in the sample, so buyers have been absorbing the selloff. This is the strongest single signal on the chart. [Accumulation]
- ADX (14): 11.9, which is very weak and range-bound. +DI (25.4) and −DI (24.6) are almost equal, and −DI just crossed back above +DI on the latest bar (after +DI had led for several sessions). There is no trend to speak of. [Weak Trend, no clear direction]
- Volume: 10.42M, average to slightly below average. Today's red candle came on unremarkable volume, while the Nov 5 reversal came on a large green volume spike, which suggests a capitulation low. [Neutral to mildly supportive]
DIVERGENCES & TRENDS
- Bullish divergence: CMF has made a new high (0.198) while price is still below its Nov 12 high and its Oct 29 high ($185), so money flow is improving faster than price.
- MACD: The bullish crossover and positive histogram came with price holding above the SMA200, which is a modest momentum recovery.
- Price vs. long-term MAs: The SMA50 ($178.73) is above the SMA200 ($170.20), so the golden-cross structure is intact. The SMA50 is flattening, though, and EMA21 is below EMA55, a short-term bearish alignment.
- Failing signals: The ADX at 11.9 and the +DI/−DI flip-flop show no trend, so the MACD and CMF signals need confirmation. Today's red candle and the −DI crossover are small cautionary notes.
- Volatility: Two sharp gap-downs (Oct 30 and Nov 5) were both bought back (a long-wicked low near $148), which shows demand around the $150–$157 area.
CHART PATTERNS
- Range / consolidation: Since mid-October price has oscillated between about $157 and $185, with ADX under 15. It is pinned between the SMA200 ($170) support and the SMA50 ($178.7) resistance.
- Possible Bullish Double Bottom: The August low (~$148–150) and the Nov 5 low (~$148) form a rough double bottom, and CMF improving at the second low supports it. The neckline is far away near $185–$190, so it is only a longer-term possibility. A move above $185 would open a measured target in the $200+ area, but that is beyond 27 days.
- No clean triangle or wedge: The swings are too erratic to count as a symmetrical triangle, so the base case is a range with an upward lean.
POTENTIAL SCENARIOS
- Scenario 1: Bullish Range-High Retest — Accumulation (CMF ~0.20) and the MACD bullish cross carry price back above EMA21/EMA55 and toward the SMA50 and upper-middle of the range. Trigger: daily close above $178.73 (SMA50) on rising volume. Target: $177–$185. Invalidation: daily close below $170.20 (SMA200). (45% probability)
- Scenario 2: Neutral Range Chop — ADX stays below 20 and price oscillates between the SMA200 and SMA50 without a decisive break. Trigger: failure at $178–$180 and a bounce at $168–$170. Target: $168–$178. Invalidation: close outside $165–$182. (30% probability)
- Scenario 3: Bearish Breakdown — Price loses the SMA200, −DI takes over, and the MACD rolls over, retesting the Nov 5 low zone. Trigger: close below $170.20 and then $165. Target: $157–$160 (lower Bollinger Band). Invalidation: reclaim of $176. (25% probability)
PRICE TARGETS
- Target Price: $177.50 (27-day, about +2.9%)
- Expected Range: $162.00 to $187.00 (width $25.00, about 14.5% of current price, which fits the 12–18% guidance for 30–60 days scaled to 27 days)
- Key Levels: Support at $170.20 (SMA200), Resistance at $178.73 (SMA50)
OVERALL BIAS
OVERALL BIAS: BULLISH - CMF shows strong accumulation (0.198) and the MACD has crossed bullishly while price holds above the SMA200 after a rejected capitulation low. The conviction is modest because ADX is very weak and price is still below the EMAs and the SMA50.
This is educational analysis and not financial advice.