QCOM 83-day bullish forecast — Nov 15, 2026
- Bias: Bullish
- Timeframe: 83 days (made Nov 15, 2026, target date Feb 5, 2027)
- Price at analysis: $172.47
- Price target: $181.00
- Expected range: $160.00 – $202.00
- Result: Pending — graded after the close on Feb 5, 2027
Get a free AI analysis of QCOM today
Analysis
TECHNICAL INDICATORS
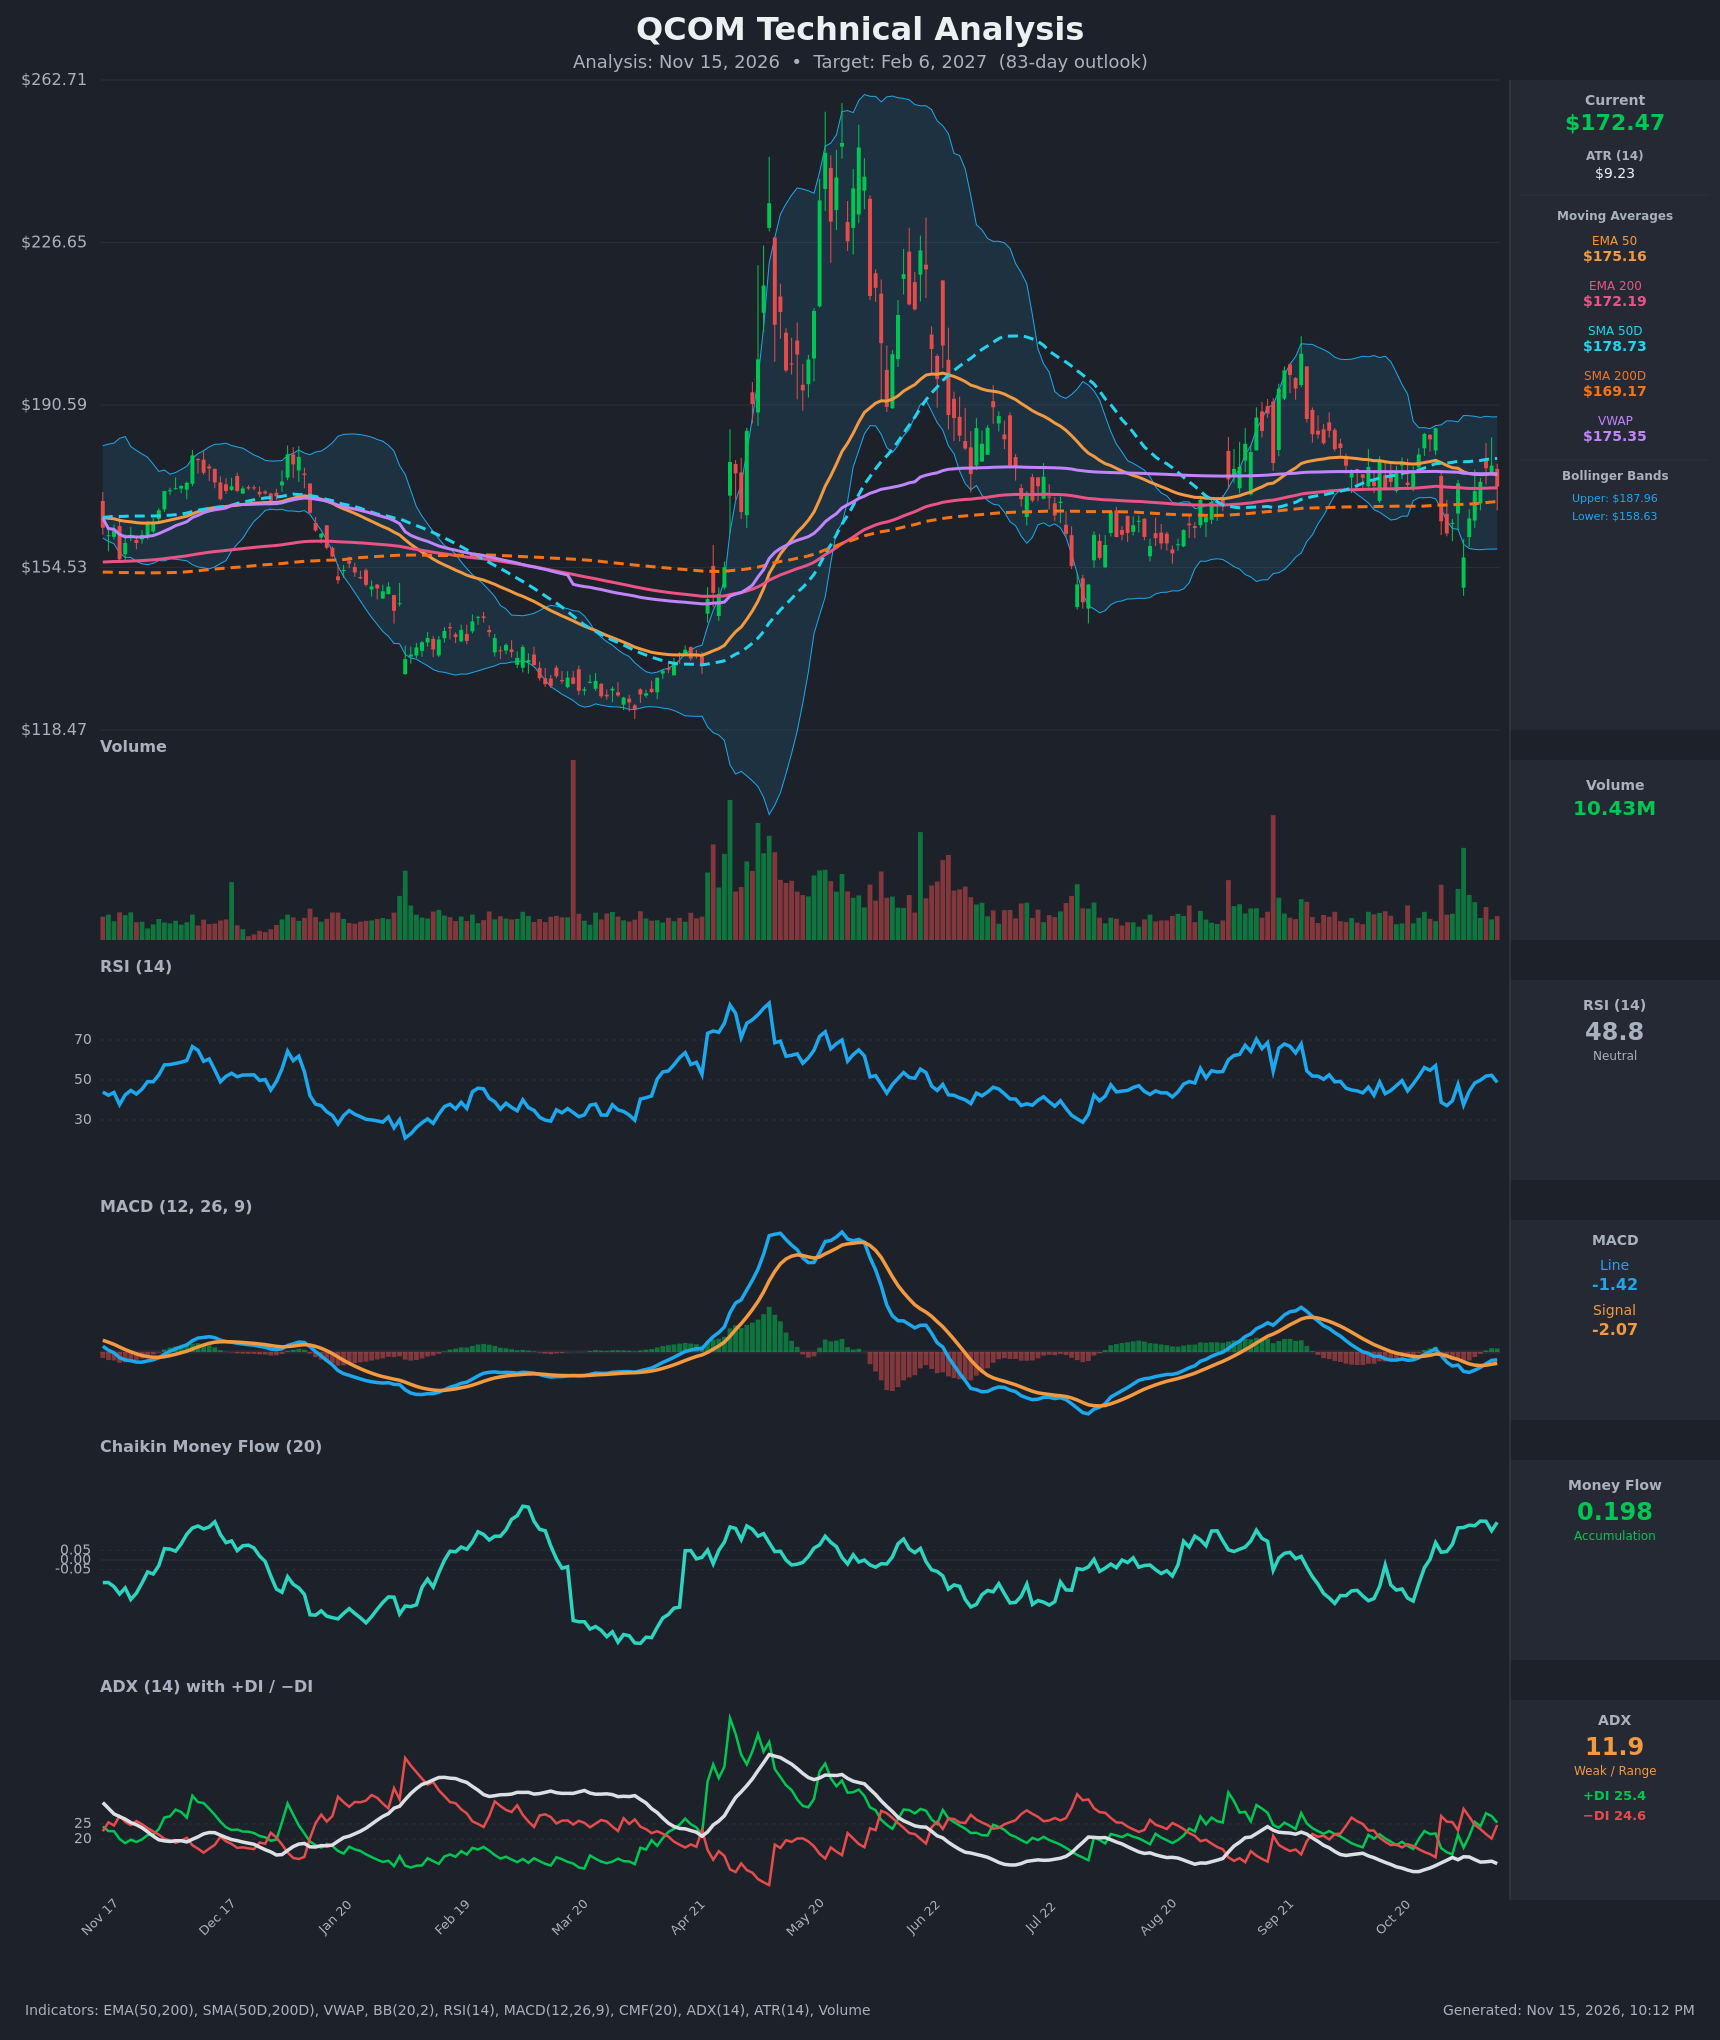
- RSI (14): 48.82, right at the midline after bouncing from 37.5 on Nov 5 and peaking near 52 on Nov 12. Momentum has recovered from the early-November selloff but has stalled, with no overbought or oversold signal. [Neutral]
- 20 EMA: Not supplied. The nearest proxy is the EMA 50 at $175.16, which sits just above price at $172.47 and acts as light resistance. Price is also barely above EMA 200 ($172.19), which is the immediate support. Price is pinned inside the cluster of averages. [Neutral]
- MACD: Line -1.42 is above signal -2.07, with the histogram positive at about +0.65 and rising. The bullish crossover came around Nov 11, but both lines are still below zero, so the improvement is early and fragile. [Bullish]
- Bollinger Bands (20): Upper $187.96, lower $158.63, midline about $173.30. Price is sitting on the midline with a moderately wide band. The Oct 30 and Nov 5 flushes tested the lower band, and rebounds were bought. [Neutral]
- CMF (20): 0.198, well above the +0.05 threshold and positive for about 12 sessions. It is near its highest level in months, showing accumulation even as price chops. [Accumulation]
- ADX (14): 11.9, very weak and falling, so the market is range-bound. +DI 25.4 is only just above −DI 24.6, and the DIs have flipped repeatedly. There is no directional control. [Weak Trend – no direction]
- Volume: 10.43M, in line with or slightly below recent averages. The spikes on the Oct 30 and Nov 5 drops have faded, and recent rebounds came on moderate volume. There is no strong conviction either way. [Neutral to slightly constructive]
Moving-average context: SMA 50D ($178.73) is above SMA 200D ($169.17), so the golden cross is intact. Price is above SMA 200D and EMA 200 but below EMA 50, SMA 50D and VWAP ($175.35). That is a long-term uptrend with short-term indecision.
DIVERGENCES & TRENDS
- CMF has been rising toward 0.20 while price made lower lows on Nov 5 and then recovered only partially. This is a mild bullish divergence, with money flow stronger than price.
- RSI made a higher low on the Nov 5 retest (37.5, versus 37.2 on Nov 2), consistent with fading downside momentum.
- The MACD bullish crossover with a rising histogram supports a recovery attempt, but it is still below the zero line.
- ADX at 11.9 is near its lows for the year, which usually precedes a volatility expansion in either direction. The DIs are converging (+DI 25.4 versus −DI 24.6), so the latest bounce has not yet turned into a trend.
- The 200-period averages are rising and tightly clustered, with the SMA 200D rising steadily from about $168 to about $169. This is a floor-like zone for dips.
- Price is compressing under the 50-day averages. A close above $178.73 (SMA 50D) would be the first confirmation of a trend change.
CHART PATTERNS
- Range consolidation (symmetrical-triangle-like): Since August, price has oscillated roughly $156–$185 with tightening swings and converging averages. The weak ADX supports a coil. In the reference diagram this resembles a Symmetrical Triangle, which can break either way.
- Possible Bullish Double Bottom: The lows near $162 (Nov 3) and $156.75 (Nov 5), with a neckline around $185 (Oct 29 high). A close above $185 would project to about $213 (neckline plus the roughly $28 pattern height). This is not yet confirmed.
- Bearish risk: A close below about $156 would break the range floor and invalidate the double bottom. It would open a retest of the $140–$145 area (July lows), which the reference diagram's bearish range-breakdown patterns would support.
- Significance: The accumulation (CMF) and golden cross favor an upside resolution. The range is still intact, so the targets are moderate until $185 breaks.
POTENTIAL SCENARIOS
- Scenario 1: Bullish Range Breakout and Recovery — Accumulation (CMF about 0.20) and the MACD crossover carry price above the 50-day averages and out of the multi-month range, toward the upper Bollinger Band area. Trigger: daily close above $178.73 (SMA 50D), then above $185. Target: $181–$195, with an extension to about $205 on a clean break of $188. Invalidation: close below $165 and failure to hold the 200-period averages. (45% probability)
- Scenario 2: Neutral Continued Chop — ADX stays below 20 and price keeps oscillating around the stacked averages between about $160 and $185. Trigger: repeated rejections near $178–$185 and buying near $162–$169. Target: $165–$178. Invalidation: close outside $156–$188. (32% probability)
- Scenario 3: Bearish Range Breakdown — A macro or earnings-related shock pushes price below the SMA 200D and the November lows. Trigger: close below $156.75, with −DI regaining dominance and CMF falling below zero. Target: $145–$150. Invalidation: reclaim of $172–$175 on strong volume. (23% probability)
PRICE TARGETS
- Target Price: $181.00 (83-day, about +5% from the current price)
- Expected Range: $160.00 to $202.00 (width $42, about 24% of current price, consistent with 61–180 day guidance)
- Key Levels: Support at $169.17 (SMA 200D, with $158.63 lower Bollinger Band below it), Resistance at $178.73 (SMA 50D, with $187.96 upper Bollinger Band above it)
OVERALL BIAS
OVERALL BIAS: BULLISH - Long-term structure is intact (golden cross, price above the 200-period averages), CMF shows sustained accumulation, and MACD has crossed up. Weak ADX and the overhead averages limit conviction, so the expected gain is modest.
This is educational analysis and not financial advice.