^SPX 3-day bearish forecast — Oct 30, 2026
- Bias: Bearish
- Timeframe: 3 days (made Oct 30, 2026, target date Nov 2, 2026)
- Price at analysis: $7631.43
- Price target: $7605.00
- Expected range: $7490.00 – $7740.00
- Result: Correct (-1.2%) — closed at $7541.40 on Nov 2, 2026; quality score 100/100
Get a free AI analysis of ^SPX today
Analysis
TECHNICAL INDICATORS
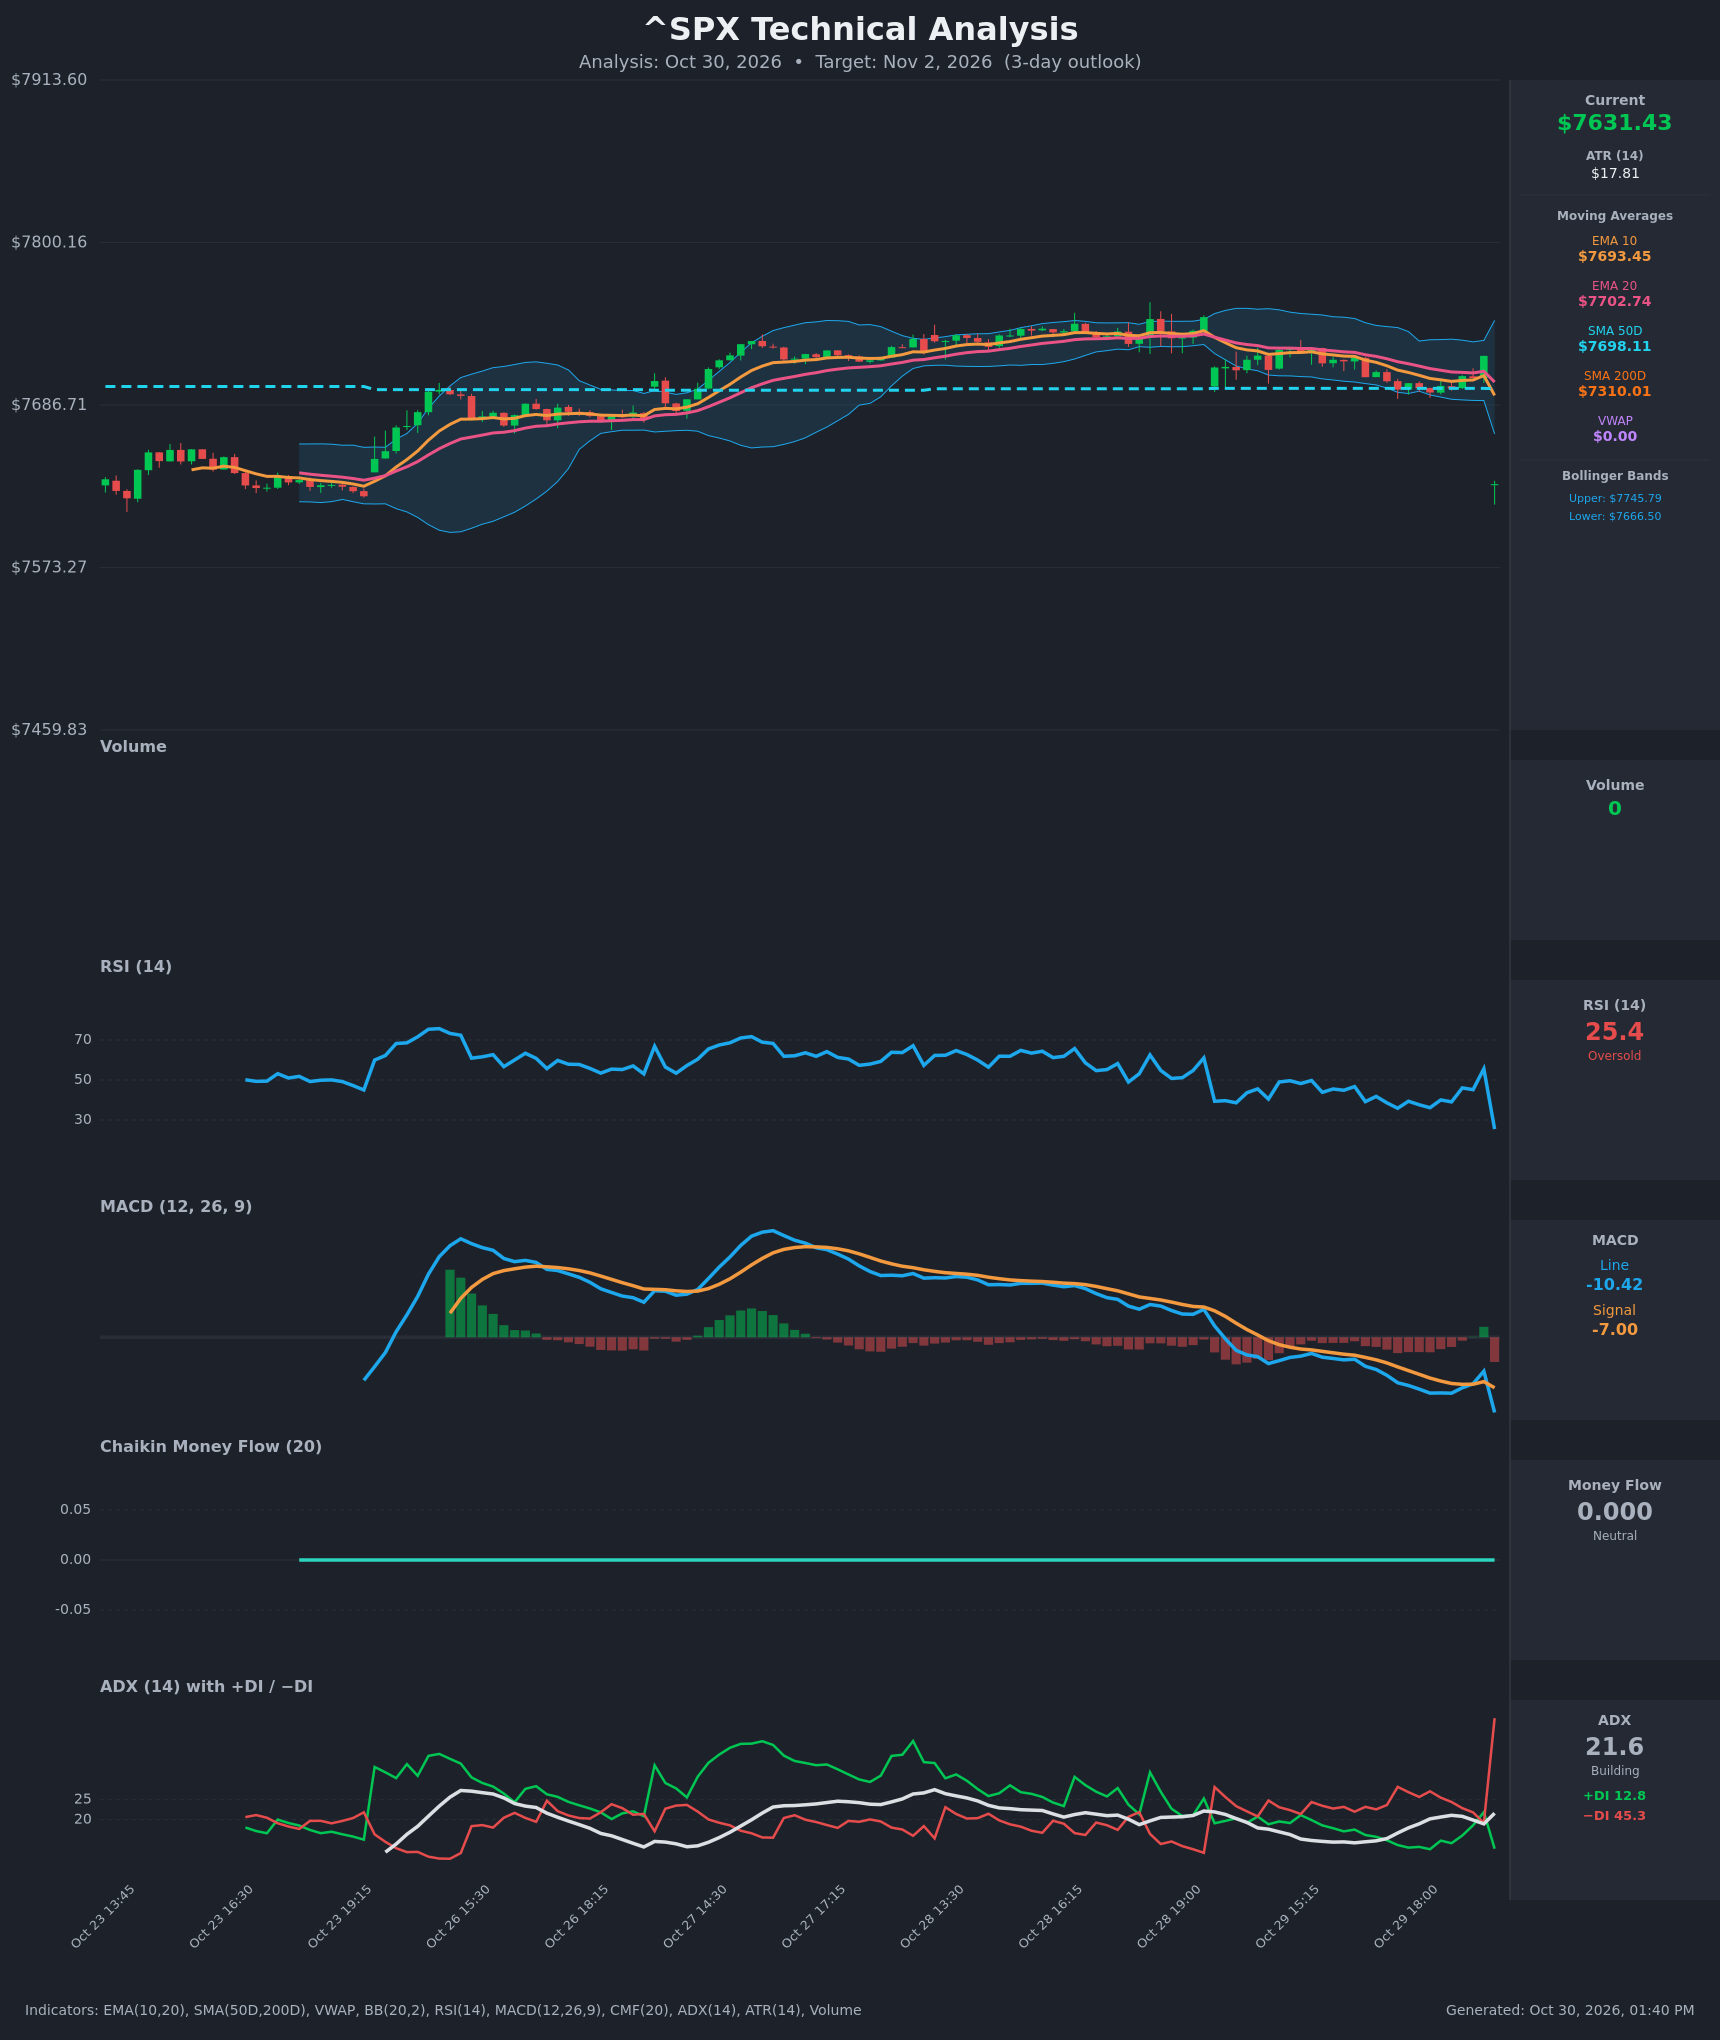
- RSI (14): 25.45, deeply oversold. It collapsed from 55.6 on the prior bar to 25.4 in one bar, so momentum is sharply negative. Oversold readings can bring a bounce, but they are not a reversal signal on their own. [Bearish]
- 20 EMA: $7702.74, with EMA10 at $7693.45. Price at $7631.43 is about 71 points (about 0.9%) below the 20 EMA, so both EMAs now act as overhead resistance. EMA10 is below EMA20 and the gap is widening. [Bearish]
- MACD: Line -10.42 is below signal -7.00, a bearish crossover that occurred on the last bar after a brief recovery. The histogram is negative (about -3.4) and expanding, and both lines are below zero. [Bearish]
- Bollinger Bands (20): Upper $7745.79 and lower $7666.50. Price is about 35 points (about 2 ATR on the 15-min series) below the lower band after a gap down. This is a stretched, band-breaking move. It signals strong downside momentum, with a mean-reversion risk back toward the band. [Bearish]
- CMF (20): 0.000, flat and inside the ±0.05 neutral zone. It is flat at exactly zero (likely no volume data for the index), so it provides no information. [Neutral]
- ADX (14): 21.6, rising from the 14–20 range, with +DI at 12.8 and −DI at 45.3. The −DI is far above +DI, so sellers dominate. ADX is only just above 20, so the trend is still early. [Weak-to-Building Trend, Bearish]
- Volume: 0, so volume data is unavailable (index) and cannot confirm or refute the move. Price action alone shows a decisive gap lower. VWAP is also unavailable ($0.00). [Neutral / No confirmation]
DIVERGENCES & TRENDS
- There is no bullish RSI or MACD divergence. Momentum made new lows together with price, which confirms the weakness.
- Over the last session, RSI and MACD trended lower from the Oct 28 peak while price stayed flat around $7,700, a mild hidden warning that preceded the gap.
- The last 15 bars show a bearish EMA10/EMA20 stack with EMA10 under EMA20, and MACD crossed back below its signal on the latest bar.
- −DI spiked from about 19 to 45, a clear bearish control shift. +DI is at lows near 13.
- Price is now below the SMA50D ($7698.11) after trading pinned around it for days. This is a breakdown from that support. It remains well above the SMA200D ($7310.01), so the long-term uptrend is intact and no death cross is forming.
- The oversold RSI (25) and the close well below the lower Bollinger Band raise the odds of a technical bounce. The gap-down structure typically sees a partial retrace.
CHART PATTERNS
- Price formed a sideways-to-rounded top between about $7,690 and $7,745 and then broke down through the SMA50D and the lower Bollinger Band. This loosely resembles a Bearish Flag/Rectangle breakdown from the reference diagram, though it is not a textbook match.
- The measured move from the roughly $55 consolidation range projects toward about $7,575–7,590. That coincides with the chart's $7,573 gridline level.
- The gap down leaves an overhead gap between about $7,631 and $7,721. This zone, along with the SMA50D and EMAs, should act as resistance on any bounce.
- There is no clear reversal pattern such as a double bottom or falling wedge yet. Confidence in pattern identification is low.
POTENTIAL SCENARIOS
- Scenario 1: Bearish Breakdown Continuation — Sellers keep control (−DI 45 vs +DI 13), and bounces fail below the lower Bollinger Band and the SMA50D. Trigger: rejection at $7,666–$7,693 or a break below the session low. Target: $7,573–$7,600. Invalidation: a daily close back above $7,700 (SMA50D/EMA20). (45% probability)
- Scenario 2: Bullish Oversold Bounce / Partial Gap Fill — With RSI at 25 and price far outside the lower band, a reflex rally retraces part of the gap. Trigger: reclaim of $7,666.50 (lower band) with RSI turning above 30. Target: $7,693–$7,702 (EMA10/EMA20 and SMA50D). Invalidation: a break below $7,600 and a new low. (40% probability)
- Scenario 3: Neutral Choppy Digestion — Price consolidates in the $7,600–$7,670 zone as the oversold reading unwinds without direction. Trigger: low-volatility inside days. Target: about $7,630. Invalidation: a break outside $7,590–$7,680. (15% probability)
PRICE TARGETS
Timeframe: 3 days (target date Nov 2, 2026).
- Target Price: $7,605.00
- Expected Range: $7,490.00 to $7,740.00 (width $250, about 3.3% of the current price, in line with the 2-4% guide for a 3-day horizon)
- Key Levels: Support at $7,573.27, Resistance at $7,666.50
OVERALL BIAS
OVERALL BIAS: BEARISH - Price gapped sharply below both EMAs, the SMA50D and the lower Bollinger Band, with a fresh bearish MACD cross and a dominant −DI (45.3 vs 12.8). Oversold RSI (25.4) raises bounce risk, but the weight of evidence still favors modest downside continuation toward $7,605, with resistance at $7,666.
This is educational analysis and not financial advice.