^SPX 31-day bearish forecast — Nov 14, 2026
- Bias: Bearish
- Timeframe: 31 days (made Nov 14, 2026, target date Dec 14, 2026)
- Price at analysis: $7561.67
- Price target: $7505.00
- Expected range: $7000.00 – $7980.00
- Result: Pending — graded after the close on Dec 14, 2026
Get a free AI analysis of ^SPX today
Analysis
TECHNICAL INDICATORS
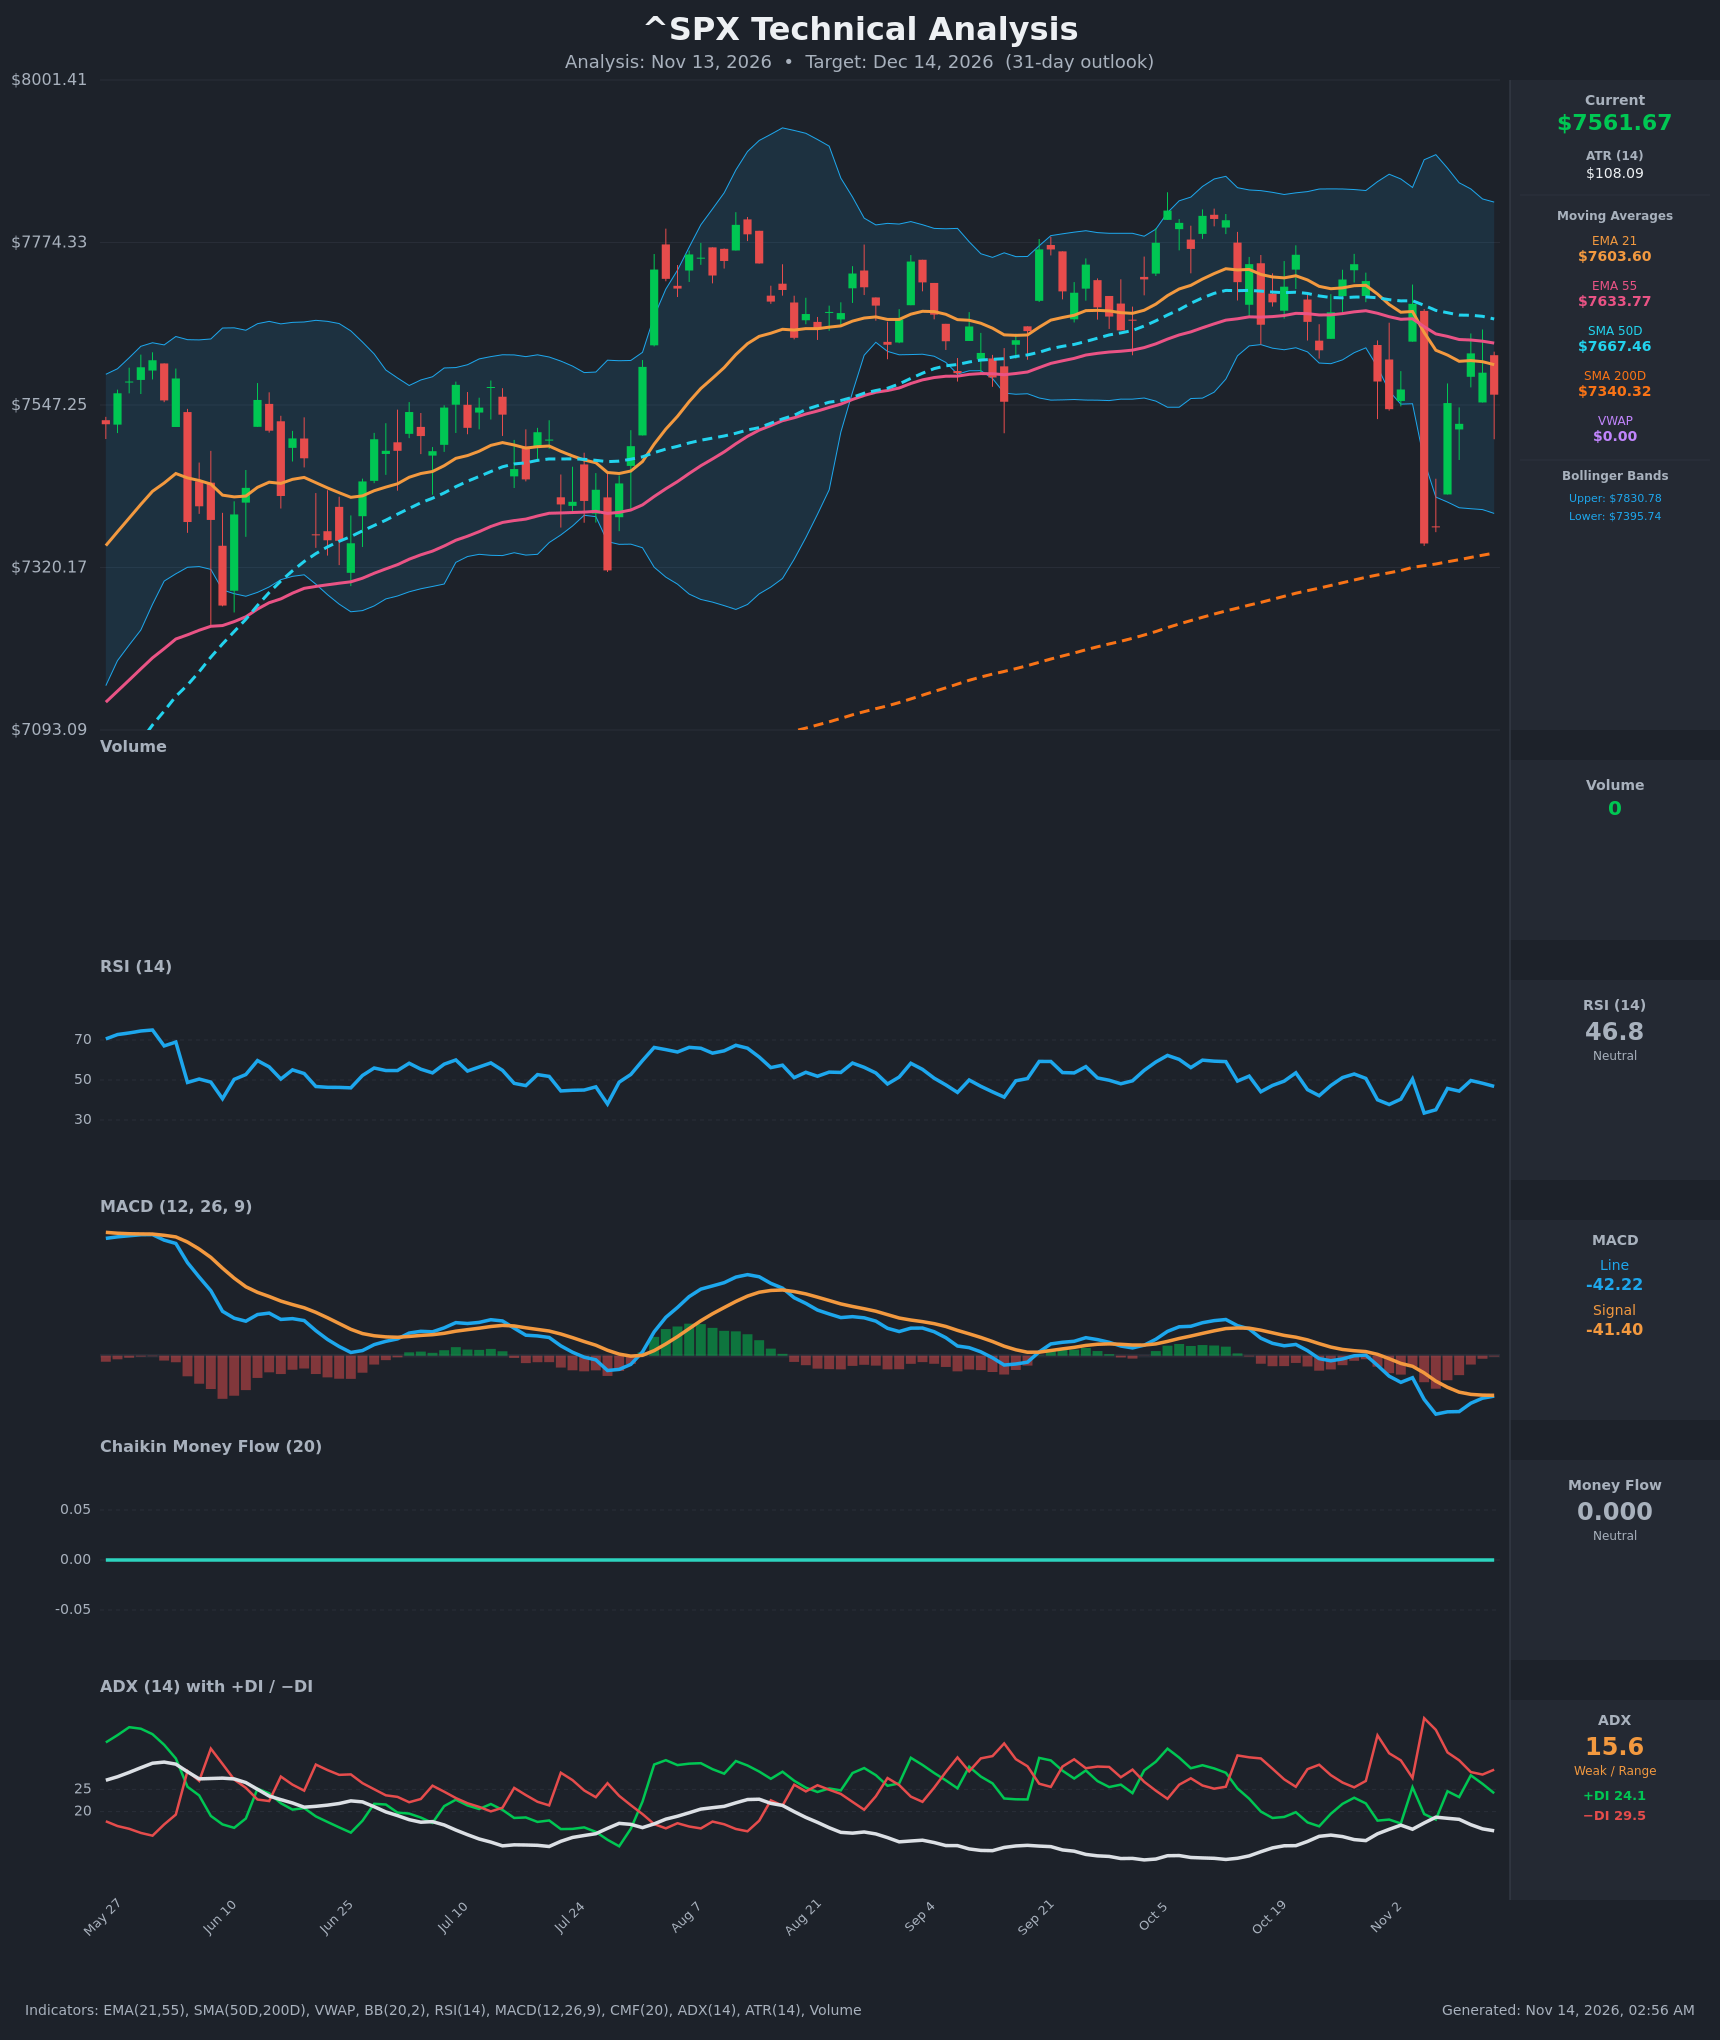
- RSI (14): 46.81, just under the 50 midline. It has recovered from the 33.5 low on Nov 5 but has stalled in the 45-50 zone over the last five bars. Momentum is neutral to slightly soft. [Neutral]
- 20 EMA (EMA 21): $7603.60, with price at $7561.67 about 0.55% below it. EMA 21 is now below EMA 55 ($7633.77), which confirms a short-term bearish crossover that occurred around Nov 5. Both averages are sloping down and act as overhead resistance. [Bearish]
- MACD: Line -42.22 vs. signal -41.40, so the line sits marginally below the signal. It is a negative-zone reading after the deep dip to -61. The line has been converging on the signal, so the histogram is nearly flat and a bullish cross is possible. Momentum is still negative overall. [Bearish]
- Bollinger Bands (20): Upper $7830.78, lower $7395.74, mid-band about $7613. Price is just below the midline, and the bands are wide after the Nov 5 flush (-4.4% day). There is no squeeze or band-walk. [Neutral]
- CMF (20): 0.000 is flat and uninformative, which matches the zero volume feed. It gives no accumulation or distribution signal. [Neutral]
- ADX (14): 15.6 with −DI (29.5) above +DI (24.1). The trend is weak and range-bound, with a mild bearish tilt. ADX has been drifting low for months. [Weak Trend, bearish tilt]
- Volume: 0, so the data feed is unavailable and no volume confirmation can be used. This analysis relies on price and momentum. [Neutral / no information]
Other moving averages: SMA50D is $7667.46 and falling slightly, SMA200D is $7340.32 and rising. Price is above the SMA200D, so the long-term uptrend is intact, but it is below the SMA50D, so the medium term is weak.
DIVERGENCES & TRENDS
- There is no clear price/RSI divergence. Price made a lower low on Nov 5-6 (about $7354) with RSI at 33.5-35, and the Nov 13 close of $7561 is above that low with RSI at 46.8. This is a mild, constructive stabilization but not a true divergence.
- MACD made a new low of about -61 and has since recovered toward the signal line. A bullish cross is close, but it would occur below zero, so it would be a weak signal.
- The EMA 21 < EMA 55 < SMA50D stack is bearish in the short and medium term. The SMA200D has been rising and is about 3% below price, which is the major support zone.
- The DI lines have flipped repeatedly (−DI on top in 4 of the last 5 bars) with ADX under 20. This is a choppy, directionless market with a slight bearish lean.
- The Nov 5 drop was a large red candle with a long wick down, and it was partially retraced. That points to dip-buying interest but also to elevated volatility.
CHART PATTERNS
- Broad range / lower highs: Price has traded roughly $7350–$7830 since July. Recent highs near $7744 (Oct 28) are below the early-October highs near $7800, which hints at a Bearish Expanding Triangle / distribution-style structure. This is not confirmed.
- Possible Bearish Head and Shoulders / double-top shape at the Sep-Oct highs, with a neckline around $7550-$7600 that price is now sitting on. A decisive break would project toward $7350-$7400, which is also the SMA200D and Nov 5 low zone.
- The counter-view is a Bullish Double Bottom near $7354-$7377 (Nov 5-6) with a $7690 neckline. A breakout above $7690 would open $7830+.
- Overall, the structure is ambiguous. The bearish rollover in the averages slightly outweighs the double-bottom hope.
POTENTIAL SCENARIOS
- Scenario 1: Bearish Range Breakdown and Retest of the 200D — Price fails at the EMA 21/55 resistance ($7600-$7635), then loses the $7520 support area, with −DI dominant and MACD staying negative. Trigger: a daily close below $7520. Target: $7400, then $7340-$7355 (SMA200D and Nov 5 low). Invalidation: a daily close above $7690 (SMA50D). (40% probability)
- Scenario 2: Bullish Reclaim of the Averages — The Nov 5 dip holds as a double bottom, MACD crosses up and price reclaims the EMAs and SMA50D. Trigger: a close above $7635, then $7690. Target: $7750-$7830 (upper Bollinger Band and the Oct highs). Invalidation: a close below $7460. (33% probability)
- Scenario 3: Neutral Chop Within the Range — With ADX under 16, price oscillates between $7400 and $7700 and ends near the current level. Trigger: repeated failures at both $7690 and $7450. Target: $7550-$7620. Invalidation: a close beyond either $7390 or $7740. (27% probability)
PRICE TARGETS
For a 31-day horizon, the range should be about 12-18% wide. ATR of $108 supports a sizeable range (about $108 × √31 ≈ $600 in theoretical volatility).
- Target Price: $7,505.00 (slight bearish lean, with price expected to drift toward the lower half of the range, and 0.76% below the current price)
- Expected Range: $7,000.00 to $7,980.00 (width $980, about 13.0% of the current price)
- Key Levels: Support at $7,340.00 (SMA200D, with the Nov 5 low near $7,354), Resistance at $7,667.00 (SMA50D, with EMA 55 at $7,634 just below)
OVERALL BIAS
OVERALL BIAS: BEARISH - EMA 21 is below EMA 55 and both are below the falling SMA50D, −DI leads +DI, and MACD remains below its signal line in negative territory. Expect modest downside pressure toward $7,400-$7,500, with the rising SMA200D (about $7,340) as the main support, although weak ADX means the conviction is modest.
This is educational analysis and not financial advice.