^SPX 1-day bearish forecast — Nov 3, 2026
- Bias: Bearish
- Timeframe: 1 day (made Nov 3, 2026, target date Nov 4, 2026)
- Price at analysis: $7559.66
- Price target: $7535.00
- Expected range: $7490.00 – $7615.00
- Result: Incorrect (+1.7%) — closed at $7688.62 on Nov 4, 2026; quality score 15/100
Get a free AI analysis of ^SPX today
Analysis
TECHNICAL INDICATORS
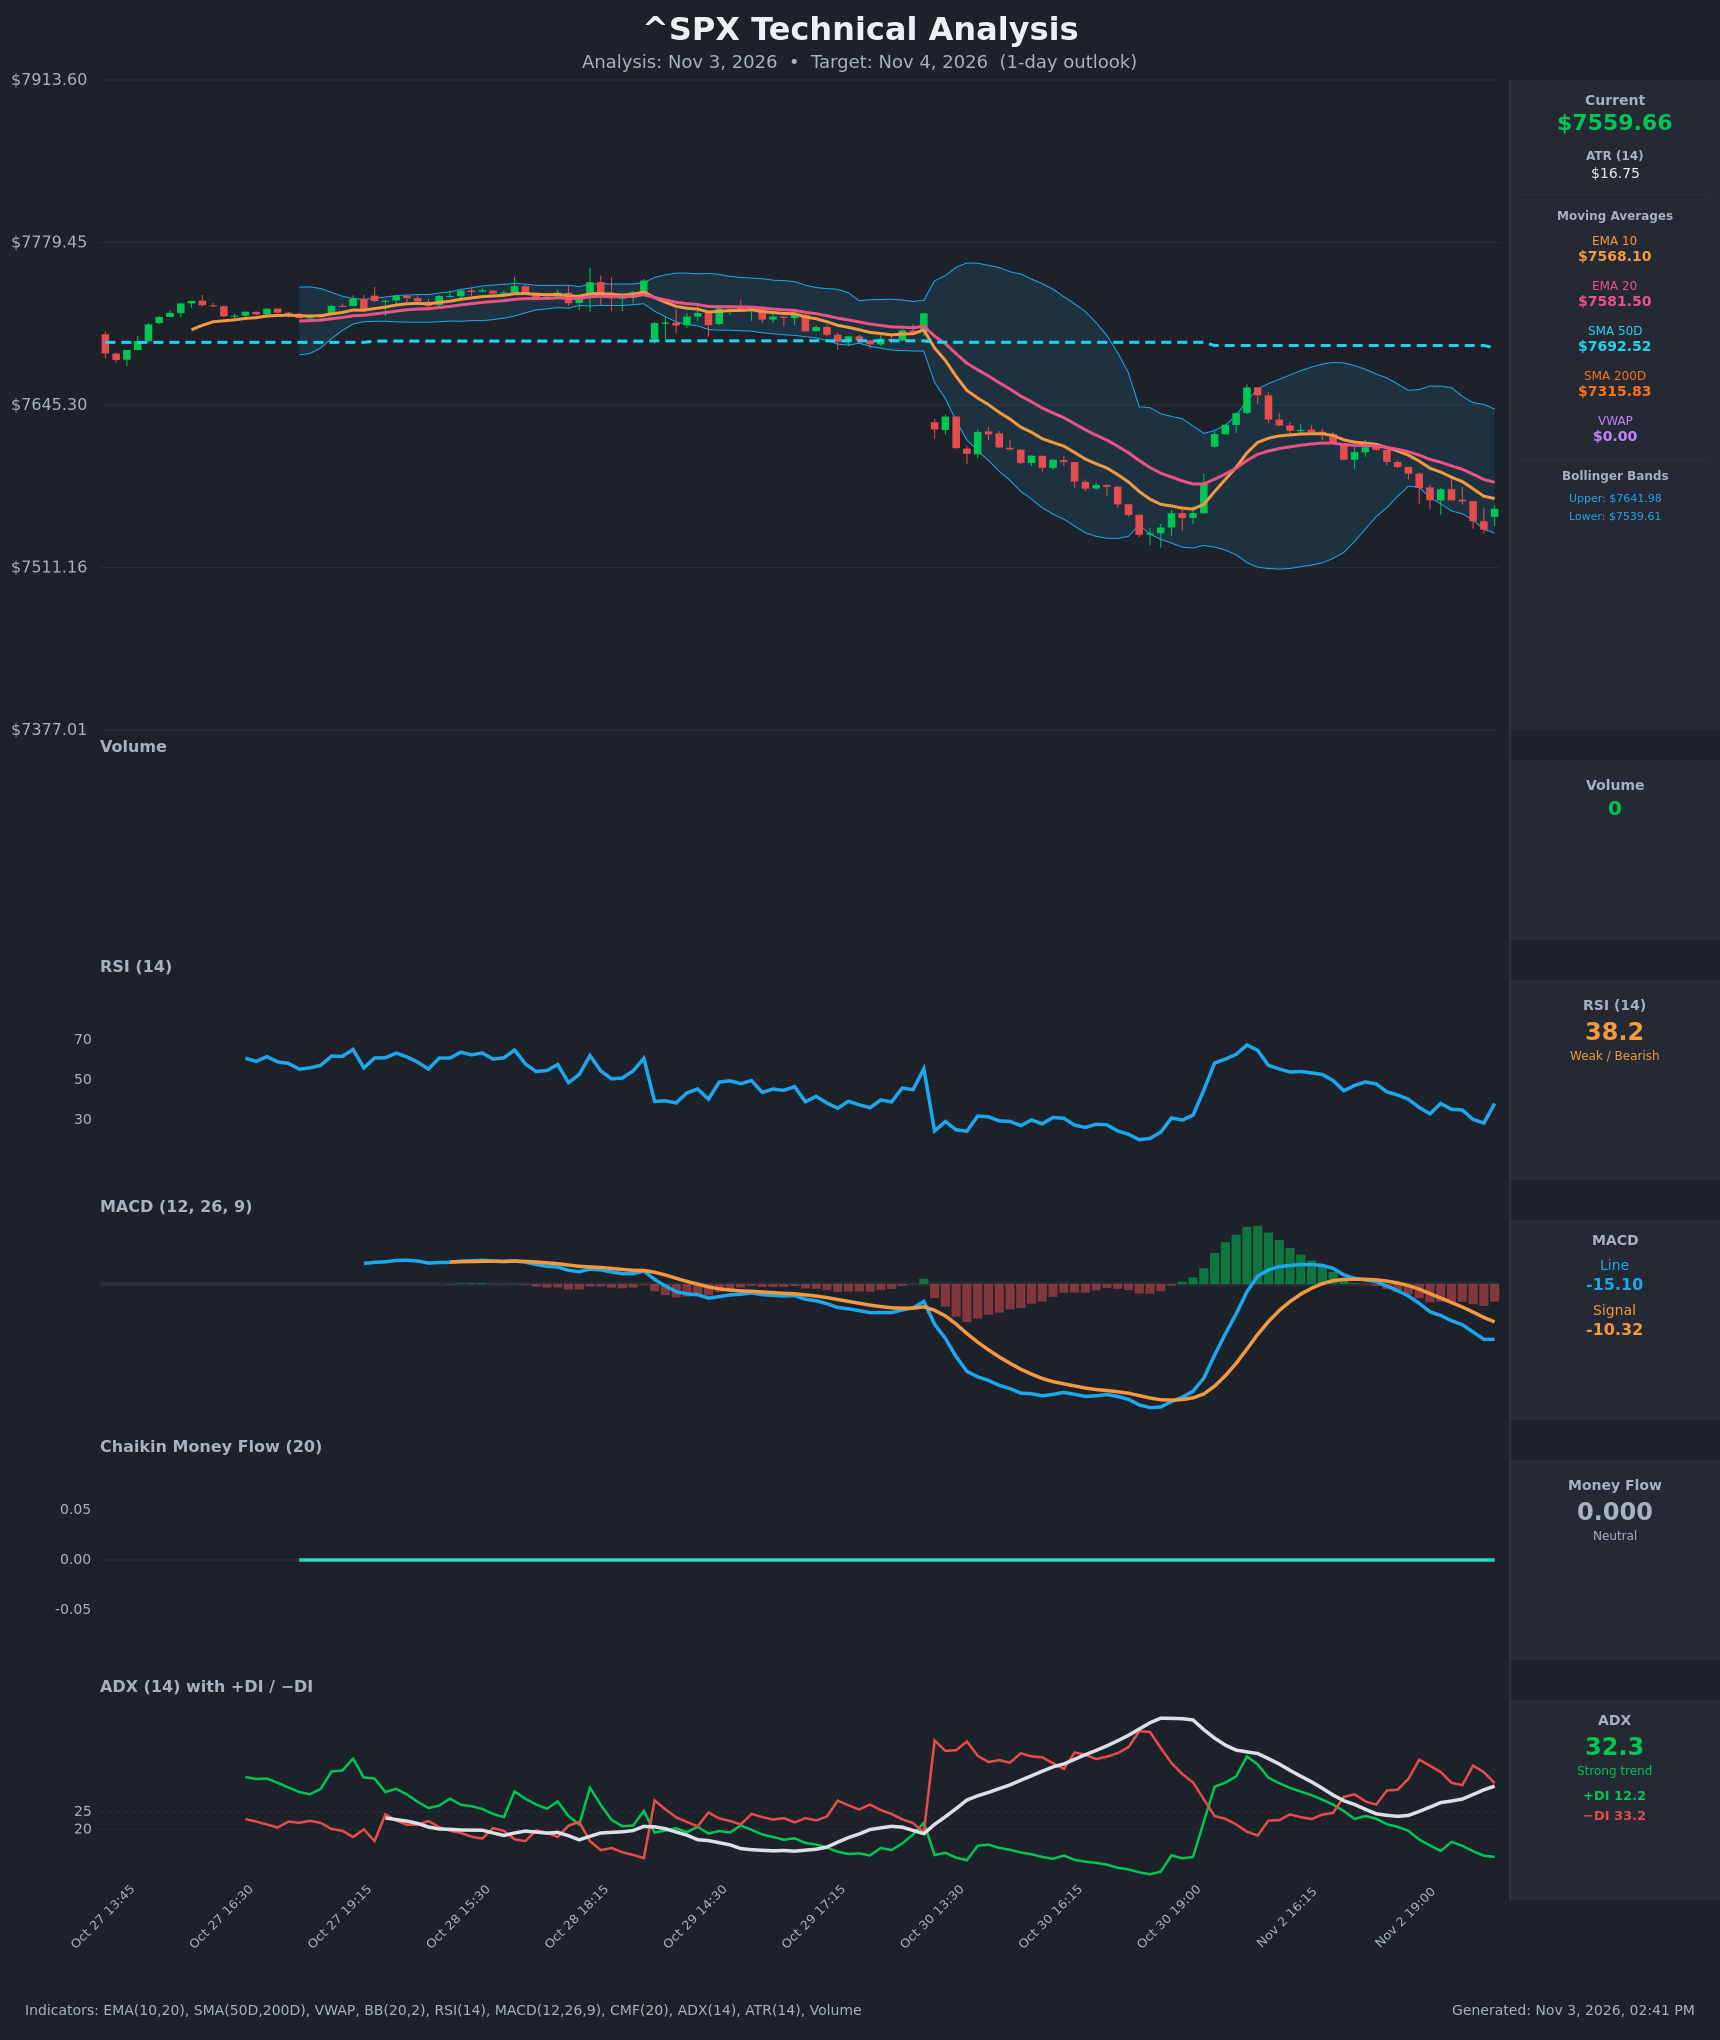
- RSI (14): 38.21. It bounced off 28.5 (oversold) on the last bar but is still below 50 and well below the prior peak of about 67. Momentum is weak, with a short-term oversold relief bounce under way. [Bearish]
- 20 EMA: $7581.50. Price ($7559.66) is below it, and EMA 10 ($7568.10) is below EMA 20 and sloping down. Both averages act as overhead resistance. [Bearish]
- MACD: Line -15.10 is below signal -10.32, so the histogram is about -4.8. The bearish crossover happened around Nov 2 18:30 and the gap is widening below zero. [Bearish]
- Bollinger Bands (20): Upper $7641.98, lower $7539.61. Price is in the lower 20% of the band, just above the lower band. The bands are wide, so volatility is elevated. A lower-band walk is bearish, but a bounce toward the midline (about $7590) is possible. [Bearish]
- CMF (20): 0.000, flat. This is almost certainly a data limitation for an index with no volume, so it provides no real information. [Neutral]
- ADX (14): 32.3 and rising, with −DI (33.2) far above +DI (12.2). This is a strong, established downtrend with bears firmly in control. [Strong Trend - Bearish]
- Volume: 0, not reported for the index, so volume cannot confirm or deny the move. VWAP is also unavailable ($0.00). [Not informative]
DIVERGENCES & TRENDS
- There is no clear divergence. Price made a lower low (7542) and RSI also made a lower low (28.5 vs the earlier ~25), so momentum confirms the price decline.
- The short-term trend is down. Price has made a series of lower highs and lower lows since the peak near $7645 on Oct 30 evening, with EMA 10 under EMA 20 and the MACD crossover bearish.
- Price sits below the SMA50D ($7692.52) and above the SMA200D ($7315.83). The medium-term trend is weakening while the long-term trend is still intact. There is no death cross, and the SMA50D is roughly 5% above the SMA200D.
- The last bar opened with a bounce from $7542 to $7559.66. RSI turned up from oversold, but price remains below both EMAs, so this looks like a relief bounce rather than a reversal.
- ADX has climbed back above 30 after a pullback from its Oct 30 peak, so trend strength is re-accelerating to the downside.
CHART PATTERNS
- Sharp drop followed by a rebound and a descending channel (Bearish Flag-type continuation): After the Oct 30 sell-off, price rebounded to about $7645 and has since rolled over in a descending sequence of lower highs and lows. This resembles the bearish continuation structures in the reference (Bearish Flag/Pennant), with a downside bias toward the prior lows near $7510 if $7539 breaks.
- Risk of a Bullish Falling Wedge: The compressing lower highs and lows with oversold RSI could resolve upward. That would need a break above EMA 10/20 ($7568–$7581), which has not happened.
- No double top/bottom or head and shoulders is clear on this timeframe.
POTENTIAL SCENARIOS
- Scenario 1: Bearish Trend Continuation — The strong ADX, −DI dominance, and bearish MACD favor another leg lower, with rallies sold at the falling EMAs. Trigger: rejection at EMA 10/20 ($7568–$7581) and a break below the $7539.61 lower band and $7542 low. Target: $7535, with an extension to about $7510. Invalidation: a close above $7581.50 (EMA 20). (55% probability)
- Scenario 2: Bullish Oversold Relief Bounce — RSI turning up from 28.5 and price hugging the lower band could trigger a mean-reversion bounce toward the band midline. Trigger: a hold above $7542 and a break above $7568 (EMA 10). Target: $7590–$7610. Invalidation: a drop below $7539 or a failure at EMA 10. (30% probability)
- Scenario 3: Neutral Chop — Price oscillates between the lower band and the EMAs without resolving. Trigger: no break of $7539 or $7581. Target: $7545–$7575. Invalidation: a break outside that range. (15% probability)
PRICE TARGETS
- Target Price: $7535.00 (1-day horizon)
- Expected Range: $7490.00 to $7615.00 (width $125, about 1.7% of current price, appropriately tighter than a 2-3 day range)
- Key Levels: Support at $7539.61 (lower Bollinger Band; the $7542 swing low sits just beneath), Resistance at $7568.10 (EMA 10, then EMA 20 at $7581.50)
OVERALL BIAS
OVERALL BIAS: BEARISH - ADX of 32.3 with −DI (33.2) far above +DI (12.2), a bearish MACD crossover below zero, and price below a falling EMA 10/20 all point lower. The oversold RSI bounce keeps conviction modest, but the bearish scenario carries the most evidence.
This is educational analysis and not financial advice.