^SPX 3-day bullish forecast — Nov 13, 2026
- Bias: Bullish
- Timeframe: 3 days (made Nov 13, 2026, target date Nov 16, 2026)
- Price at analysis: $7560.87
- Price target: $7585.00
- Expected range: $7455.00 – $7650.00
- Result: Incorrect (-1.9%) — closed at $7416.59 on Nov 16, 2026; quality score 40/100
Get a free AI analysis of ^SPX today
Analysis
TECHNICAL INDICATORS
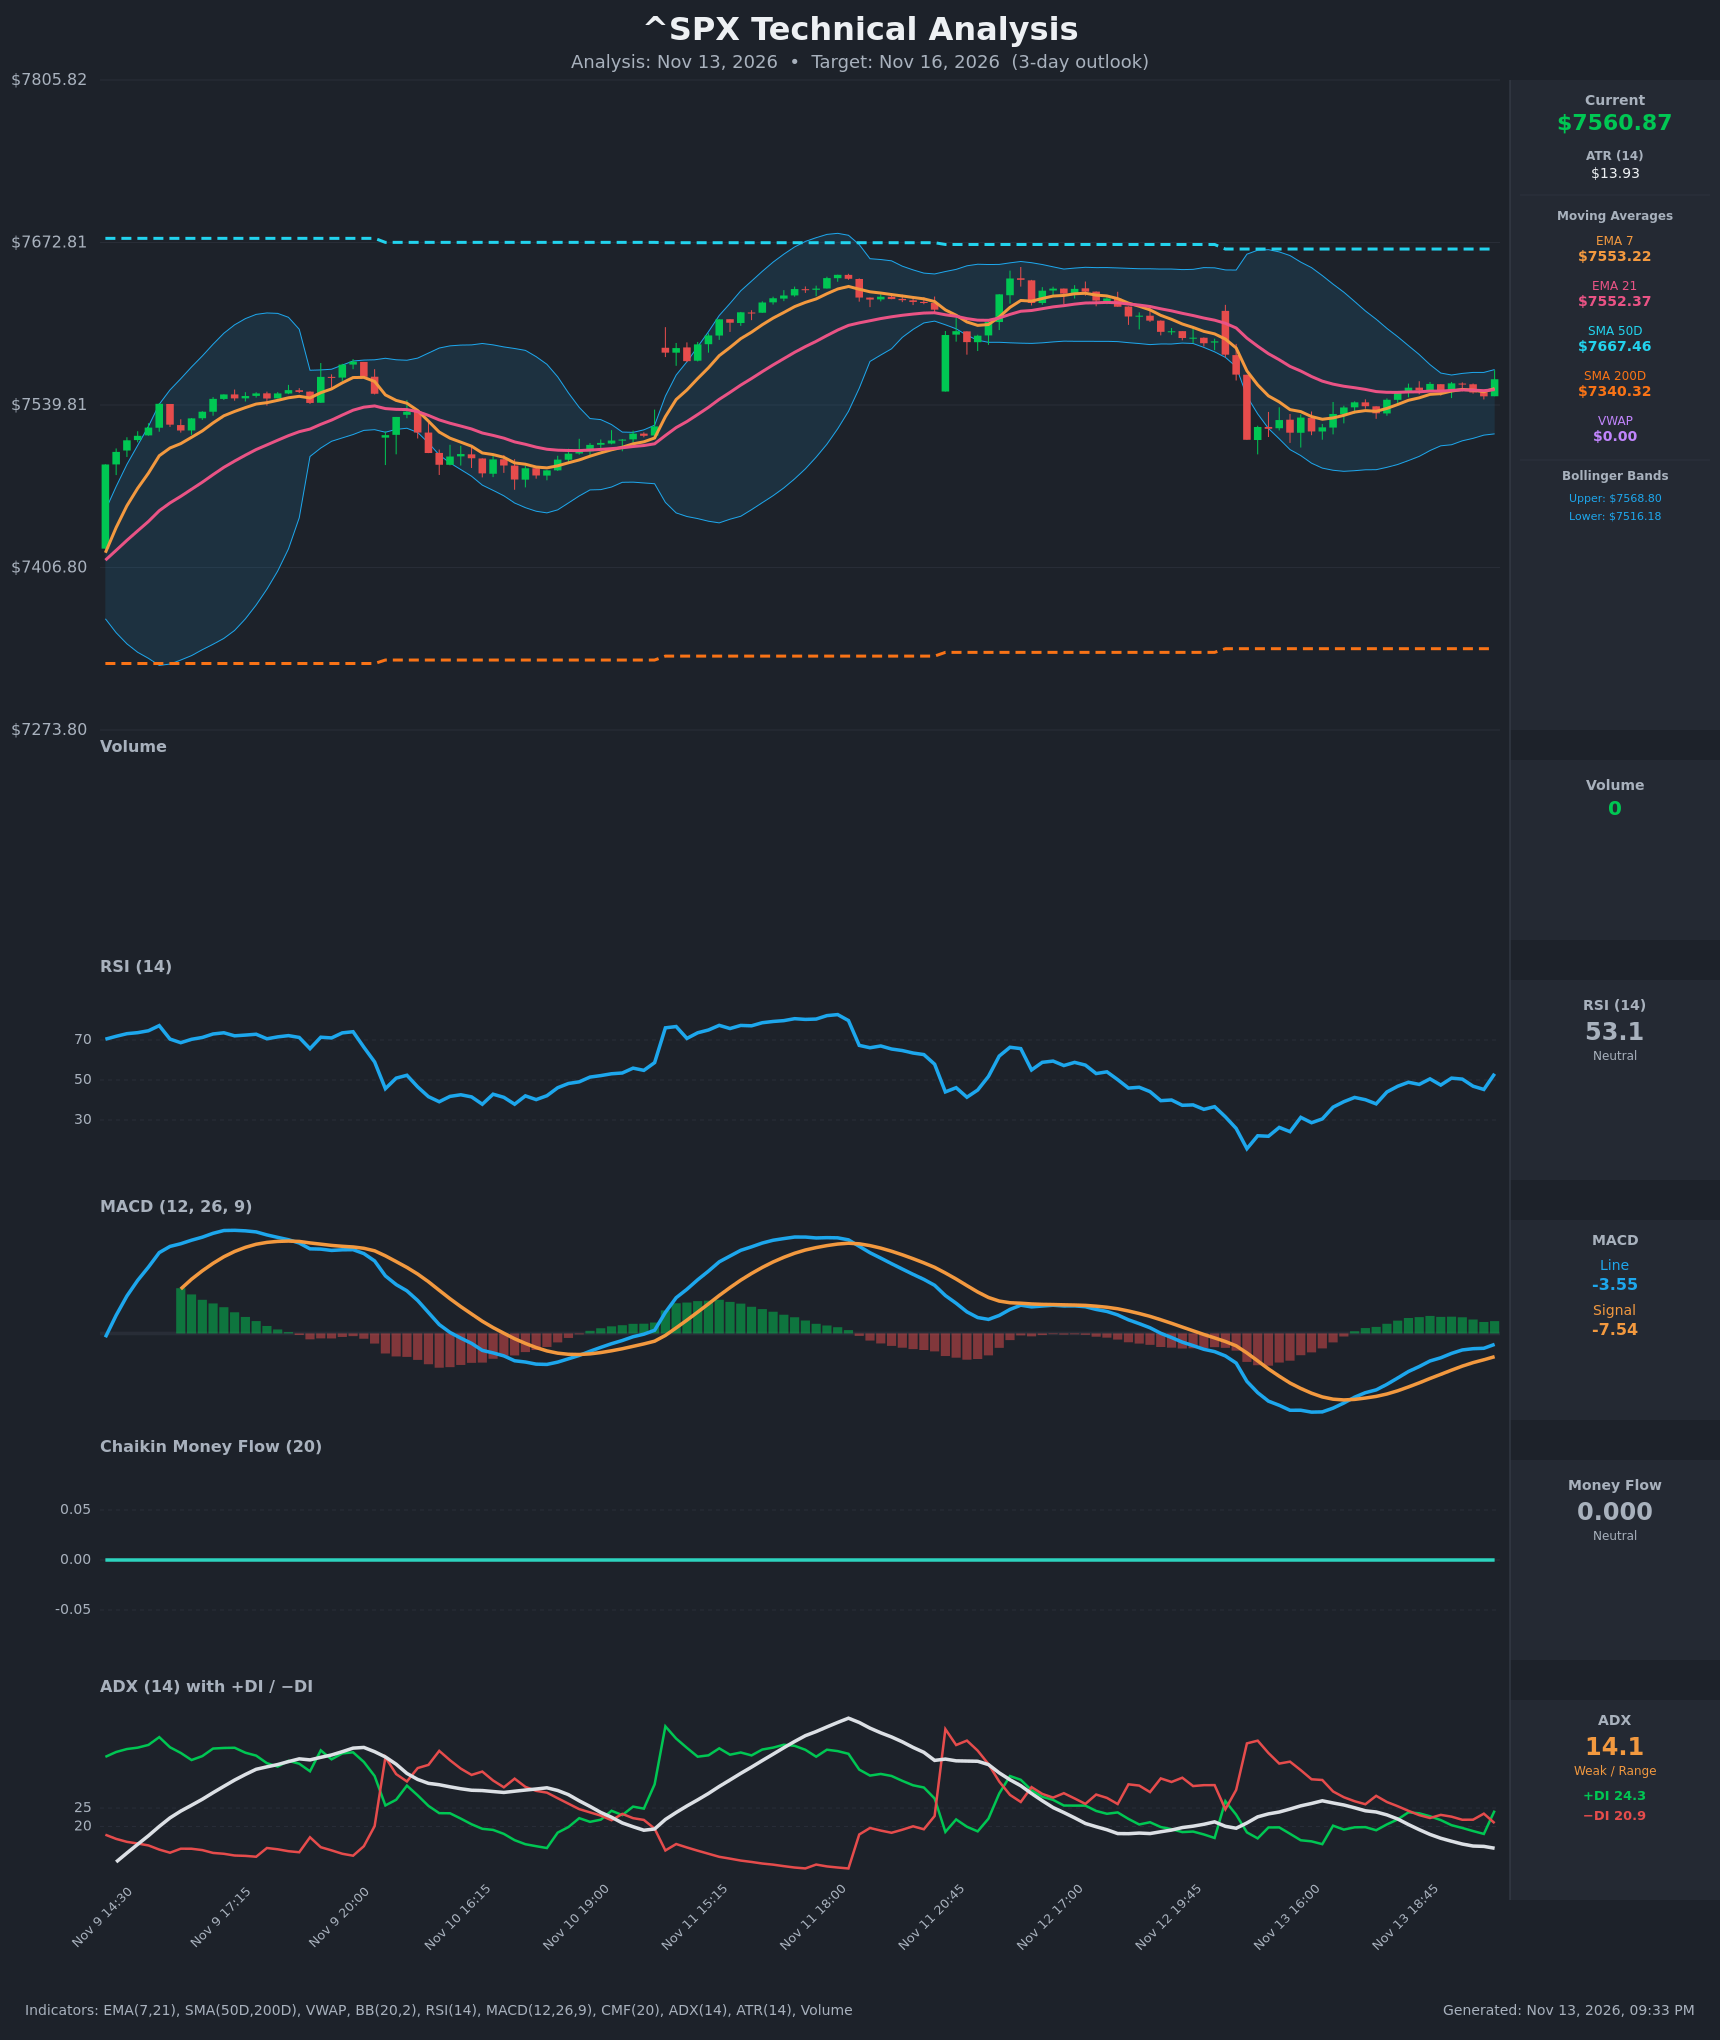
- RSI (14): 53.12, recovering from a low near 30 on the Nov 12 selloff. It has risen from 45.3 to 53.1 in the last bar. It is back above the 50 midline with no overbought or oversold signal. [Bullish]
- 20 EMA: Only EMA 7 ($7553.22) and EMA 21 ($7552.37) are provided, so I use EMA 21 as the proxy. Price at $7560.87 is above both. EMA 7 has just crossed above EMA 21 after weeks of being below it, and the two are nearly flat and tightly bunched. This is a weak but fresh bullish crossover. [Bullish]
- MACD: The line (-3.55) is still below the signal (-7.54) but has been closing the gap steadily from -22.6. The histogram is positive and rising, which is the last step before a bullish crossover. The readings are still below zero, so the recovery is not yet confirmed. [Bullish]
- Bollinger Bands (20): Upper $7568.80, lower $7516.18, so the bands are narrow (about 0.7% wide), a squeeze. Price at $7560.87 sits in the upper half of the bands, about $8 below the upper band. A squeeze usually precedes expansion, and price positioning leans slightly up. [Neutral]
- CMF (20): 0.000, flat across all bars. This is neutral and likely uninformative for an index feed with no volume data. [Neutral]
- ADX (14): 14.1 and falling from 25.8, so the market is weak and range-bound. +DI (24.3) just crossed back above −DI (20.9), a modest bullish tilt. The trend strength is too low to call a trend. [Weak Trend, slight bullish bias]
- Volume: Reads 0, so the data is unavailable for the index. Volume can't confirm or deny moves. [No information]
Longer-term context:
- Price is above the SMA200 ($7340.32), a long-term uptrend.
- Price is below the SMA50 ($7667.46), about 1.4% overhead, which acts as resistance.
- The SMA50 is above the SMA200, so there is no death cross.
DIVERGENCES & TRENDS
- Divergences: There is no clear price/indicator divergence. On the Nov 12–13 selloff, RSI hit about 30 and MACD fell deeply negative. Both have since recovered together with price.
- Momentum: RSI and MACD are both turning up from depressed levels. The MACD histogram flipped positive and has been growing for several bars.
- Crossovers:
- EMA 7 crossed above EMA 21 on the latest bars.
- +DI crossed above −DI on the last bar.
- A MACD/signal crossover is pending but not complete.
- Trend strength: ADX has fallen from 25.8 to 14.1, meaning the prior down-move lost steam. The market has shifted into low-volatility consolidation, as the Bollinger squeeze also shows.
- Overhead: The SMA50 at $7667 and the Nov 11–12 highs near $7640–7650 cap upside beyond the 3-day horizon.
CHART PATTERNS
- Bullish Flag / Pennant (continuation, loosely): After the sharp Nov 12 drop, price has been compressing in a narrow band around $7530–$7565 with a Bollinger squeeze. A break up resembles the Bullish Pennant. The resemblance is imperfect because the prior move was down, so this is closer to a base or bottoming consolidation than a true continuation.
- Possible small Double Bottom / base: The dip lows near $7520–$7530 held twice in the latest bars. A move above the $7568.80 band and $7570 area would support this reading.
- Targets: A measured pennant-style break gives roughly +$25–$40 from the breakout, which is $7590–$7600. The larger swing high near $7640 is the next hurdle.
- Overall, there is no high-conviction textbook pattern, and the structure is a low-volatility coil.
POTENTIAL SCENARIOS
- Scenario 1: Bullish Squeeze Breakout — Price breaks above the upper Bollinger Band as the MACD crosses its signal line and +DI stays above −DI. The EMA 7/21 crossover holds as support. Trigger: a close above $7569 with MACD crossing above the signal. Target: $7590–$7610, with an extension toward $7640. Invalidation: a close below $7545 (below the EMAs). (50% probability)
- Scenario 2: Neutral Range Continuation — With ADX at 14, price keeps chopping between roughly $7530 and $7570 as volatility stays compressed. Trigger: repeated failures at the upper band and holds above the EMAs. Target: $7545–$7565. Invalidation: a close beyond $7516 or $7580. (20% probability)
- Scenario 3: Bearish Rejection — The rally stalls at the upper band, the MACD crossover fails, and price slips back below the EMAs, retesting the lower band. Trigger: a close below $7545 and a −DI re-cross above +DI. Target: $7500–$7516, with a stretch toward $7480. Invalidation: a close above $7575. (30% probability)
PRICE TARGETS
Range check: $7455.00 to $7650.00 is a $195 width, or about 2.6% of the current price. That fits the 2–4% guidance for a 3-day horizon.
- Target Price: $7585.00 (3 days)
- Expected Range: $7455.00 to $7650.00
- Key Levels: Support at $7516.18 (lower Bollinger Band), Resistance at $7640.00 (recent swing high; the SMA50 at $7667 sits just above)
OVERALL BIAS
OVERALL BIAS: BULLISH - Momentum is recovering from oversold levels: RSI is back above 50, the MACD histogram is positive and the line is nearing a bullish crossover, EMA 7 crossed above EMA 21, +DI is back above −DI, and price holds above the SMA200. The bias is modest because ADX is weak (14.1) and the SMA50 sits overhead.
This is educational analysis and not financial advice.