^SPX 4-day bearish forecast — Nov 7, 2026
- Bias: Bearish
- Timeframe: 4 days (made Nov 7, 2026, target date Nov 10, 2026)
- Price at analysis: $7374.85
- Price target: $7335.00
- Expected range: $7225.00 – $7500.00
- Result: Incorrect (+2.0%) — closed at $7520.93 on Nov 10, 2026; quality score 43/100
Get a free AI analysis of ^SPX today
Analysis
TECHNICAL INDICATORS
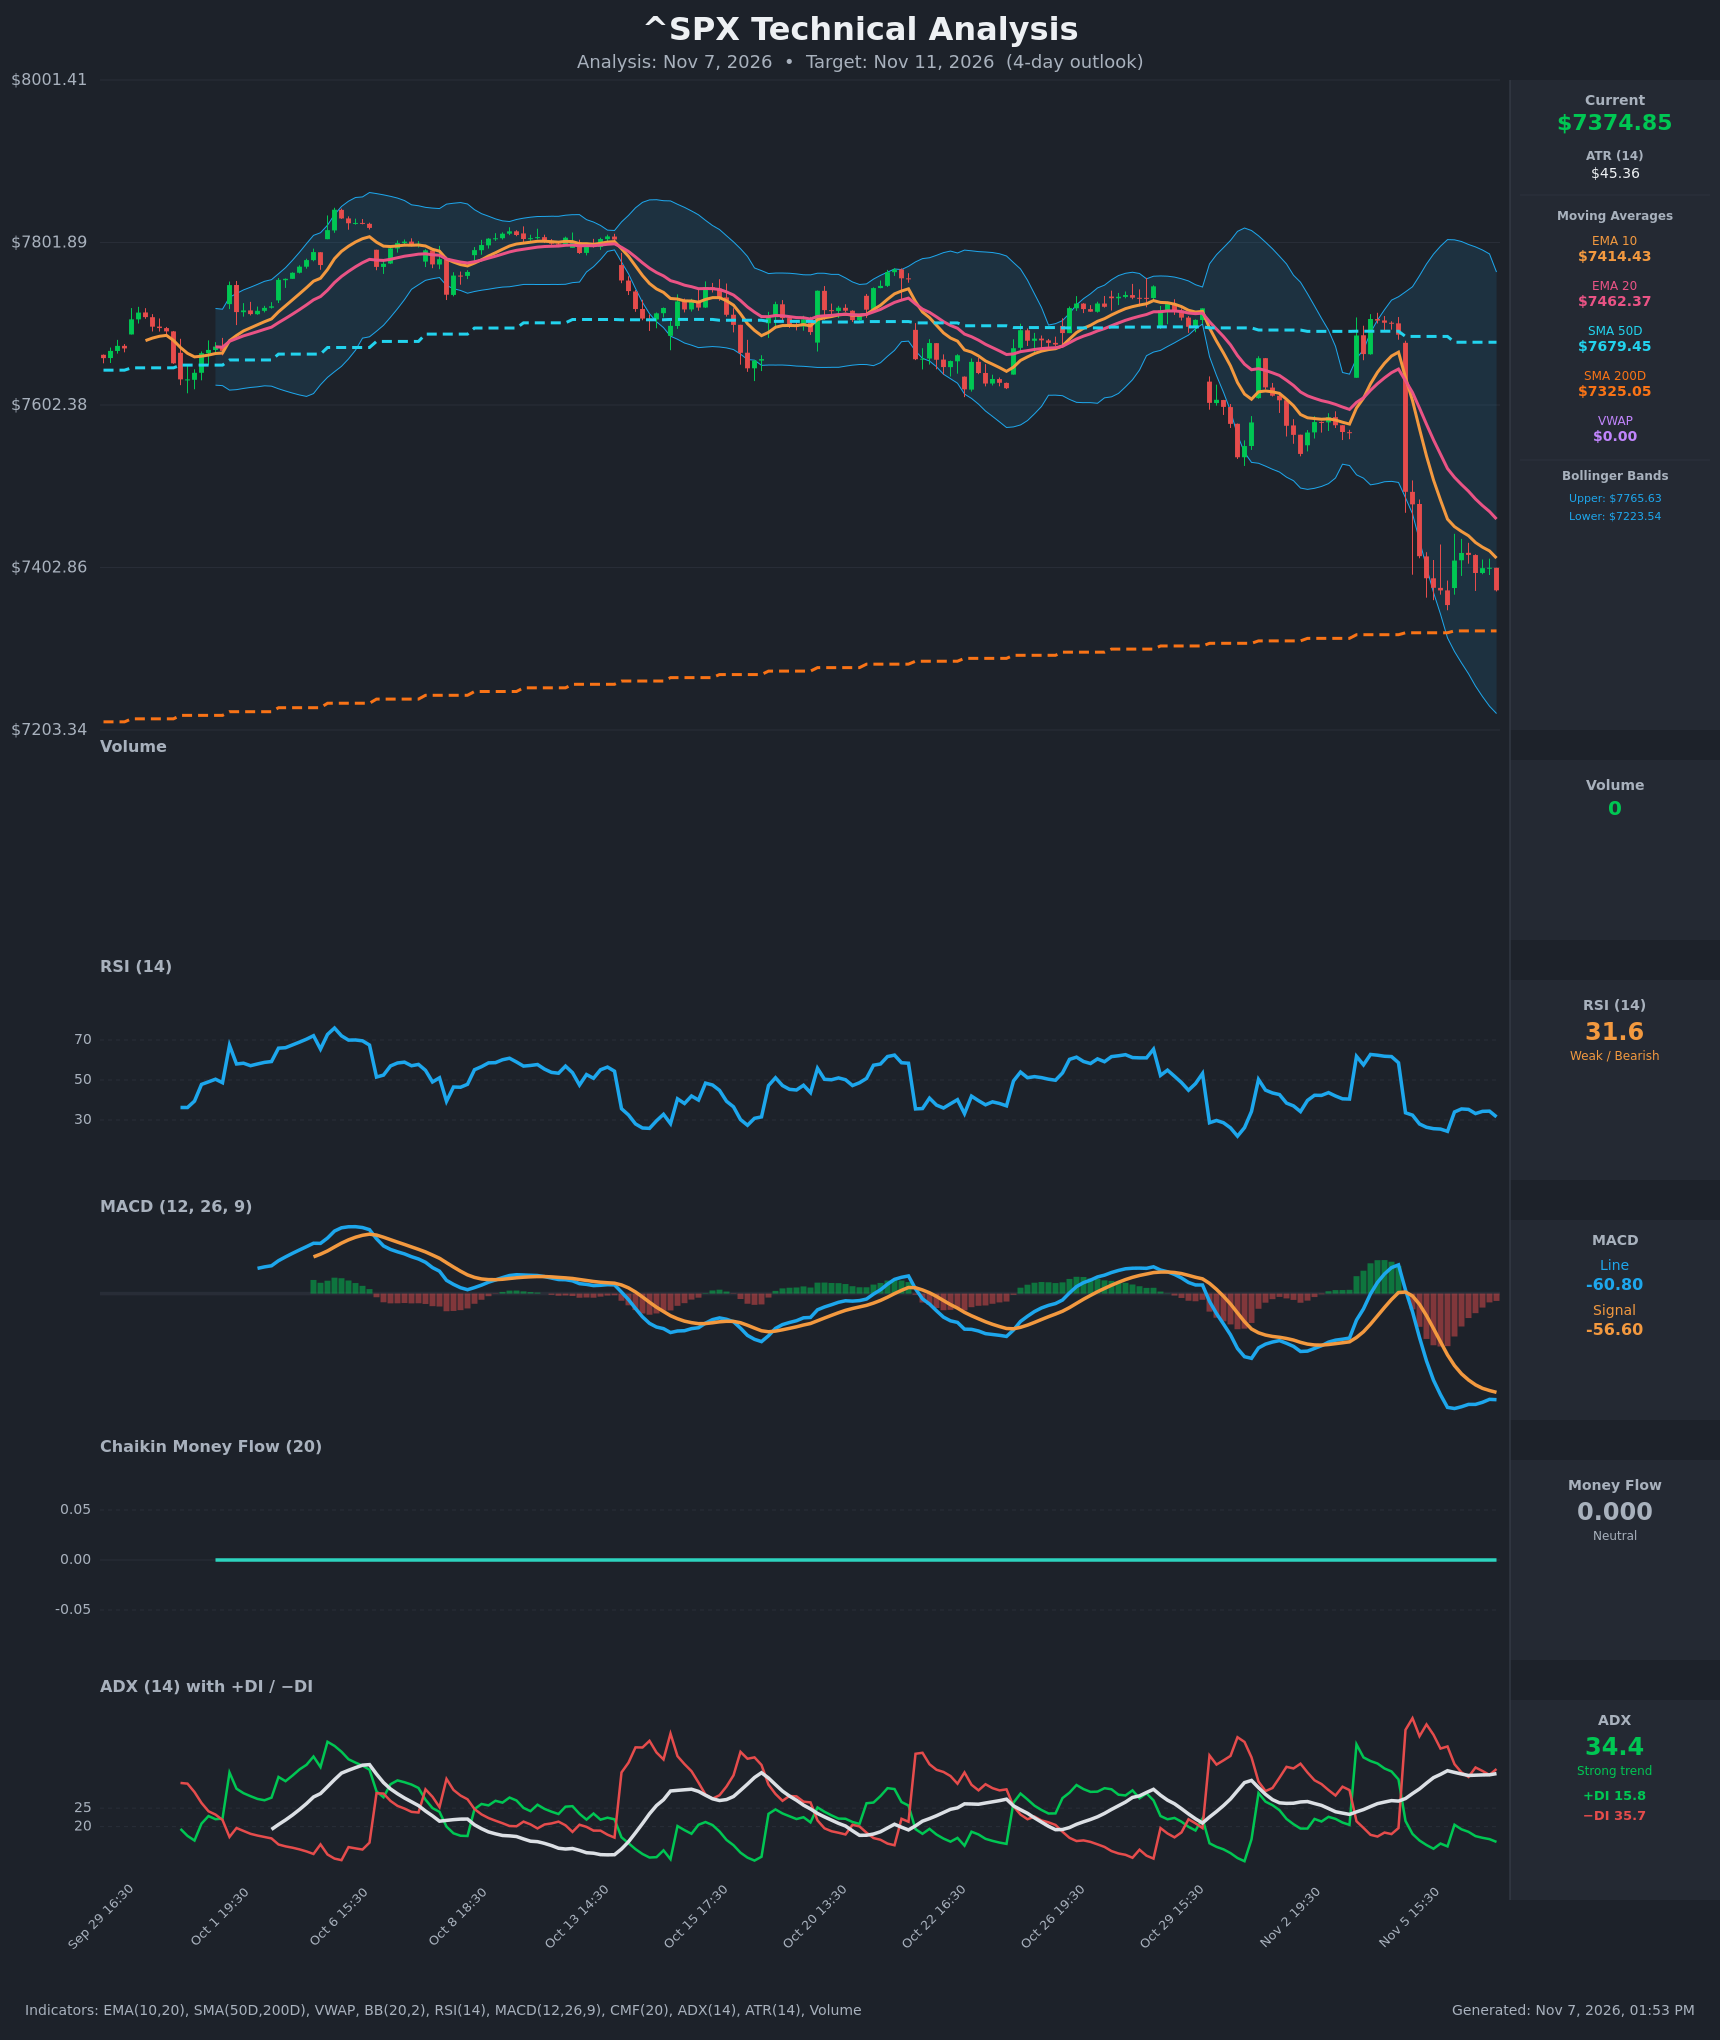
- RSI (14): 31.57, just above the oversold line at 30. It has been in the 24–35 zone since the Nov 5 breakdown, and the small bounce to about 35 has already faded. Momentum is weak with no bullish reversal yet. [Bearish]
- 20 EMA: $7462.37, about 1.2% above price and falling. EMA10 ($7414.43) is below EMA20, so the bearish crossover is confirmed. Both EMAs act as overhead resistance. [Bearish]
- MACD: Line -60.80, signal -56.60, so the line is below the signal and the histogram is slightly negative at about -4. The line has flattened and is no longer plunging (-65.9 to -60.8). That points to decelerating downside momentum, but no bullish crossover has occurred. [Bearish]
- Bollinger Bands (20): Upper $7765.63, lower $7223.54, midline about $7494. Price at $7374.85 sits in the lower third of the bands, which are wide after the sharp selloff. The bands are expanding, which is consistent with a trending move, and price is below the midline. [Bearish]
- CMF (20): 0.000, flat at zero. This is a data artifact, since volume is 0 for this index, so it gives no information. [Neutral]
- ADX (14): 34.4, a strong trend. −DI (35.7) is far above +DI (15.8), so sellers are in control. ADX is rising slowly, but −DI has been fading from its peak of about 49.5, which hints at some exhaustion. [Strong Trend – Bearish]
- Volume: 0, which is not usable for an index feed. No volume confirmation is available, so this analysis relies on price and momentum. [Neutral / No information]
DIVERGENCES & TRENDS
- Price made a lower low on Nov 5 at $7356.73, and RSI made a low of 24.3 at the same time. There is no bullish divergence yet.
- Since the Nov 5 low, price has chopped between $7357 and $7421 with RSI at 33–35. This looks like a consolidation after the drop rather than a reversal.
- The MACD line is flattening and −DI is declining from its extreme, so selling pressure is easing. Bearish momentum is still intact because the MACD line is below its signal.
- The EMA10/EMA20 bearish crossover is in place. Price is below the SMA50D ($7679.45), which has been flat to slightly lower.
- Price is above the SMA200D ($7325.05) by about 0.7%. That is the key long-term support, and the SMA50D remains above the SMA200D (no death cross).
- A large red candle on Nov 5 broke the ranges of the prior weeks. The aftermath is a small-bodied bounce that stalled under the EMA10.
CHART PATTERNS
- Bearish Flag / Pennant (continuation): After the sharp drop on Nov 5, price has formed small-bodied, sideways-to-slightly-upward candles from $7357 to $7421. This matches the Bearish Flag or Pennant in the reference diagram. A break below $7357 projects a continuation lower, with a measured move toward the SMA200D area and the lower Bollinger Band at $7223.
- Reference to the diagram's Bearish Rising Wedge: The structure is weaker than a clean wedge, so I treat it as a loose consolidation.
- Support and resistance: The SMA200D at about $7325 and the session low at $7357 are the key supports. The EMA10 at $7414 and the EMA20 at $7462 are resistance.
- With ATR at about $45, a 4-day move of roughly 1.5–2 ATR (about $70–$90) is plausible.
POTENTIAL SCENARIOS
- Scenario 1: Bearish Flag Breakdown — Price fails at the EMA10 and breaks the consolidation low, with sellers still dominant (−DI 35.7, ADX 34). Trigger: a close below $7357. Target: $7290–$7325, testing the SMA200D, with an extension toward $7223. Invalidation: a close above $7462 (EMA20). (50% probability)
- Scenario 2: Neutral Consolidation Above the SMA200D — The market chops between $7325 and $7420 as RSI stays near 30 and downside momentum fades. Trigger: the SMA200D holds and price stays under the EMA10. Target: $7340–$7410. Invalidation: a close below $7320 or above $7465. (25% probability)
- Scenario 3: Bullish Oversold Bounce — RSI near oversold and MACD flattening lead to a relief rally toward the EMAs. Trigger: a close above $7420 (EMA10) with RSI back above 40. Target: $7462–$7500, the EMA20 and Bollinger midline. Invalidation: a close back below $7357. (25% probability)
PRICE TARGETS
For a 4-day timeframe the range width should be about 3–5% of price. The Expected Range is $7225 to $7500, a $275 width, which is 3.7% of $7374.85 and in line with the guidance.
- Target Price: $7335.00 (4 days)
- Expected Range: $7225.00 to $7500.00
- Key Levels: Support at $7325.05 (SMA200D), Resistance at $7414.43 (EMA10)
OVERALL BIAS
OVERALL BIAS: BEARISH - Price is below both EMAs with a confirmed bearish EMA crossover and a MACD line under its signal. ADX is strong at 34.4 with −DI far above +DI, and the post-drop consolidation looks like a bearish flag. The SMA200D near $7325 is likely to provide support, which limits the downside, and an oversold bounce is a real risk.
This is educational analysis and not financial advice.