^SPX 1-day bearish forecast — Nov 11, 2026
- Bias: Bearish
- Timeframe: 1 day (made Nov 11, 2026, target date Nov 12, 2026)
- Price at analysis: $7592.96
- Price target: $7565.00
- Expected range: $7500.00 – $7650.00
- Result: Correct (0.0%) — closed at $7592.40 on Nov 12, 2026; quality score 100/100
Get a free AI analysis of ^SPX today
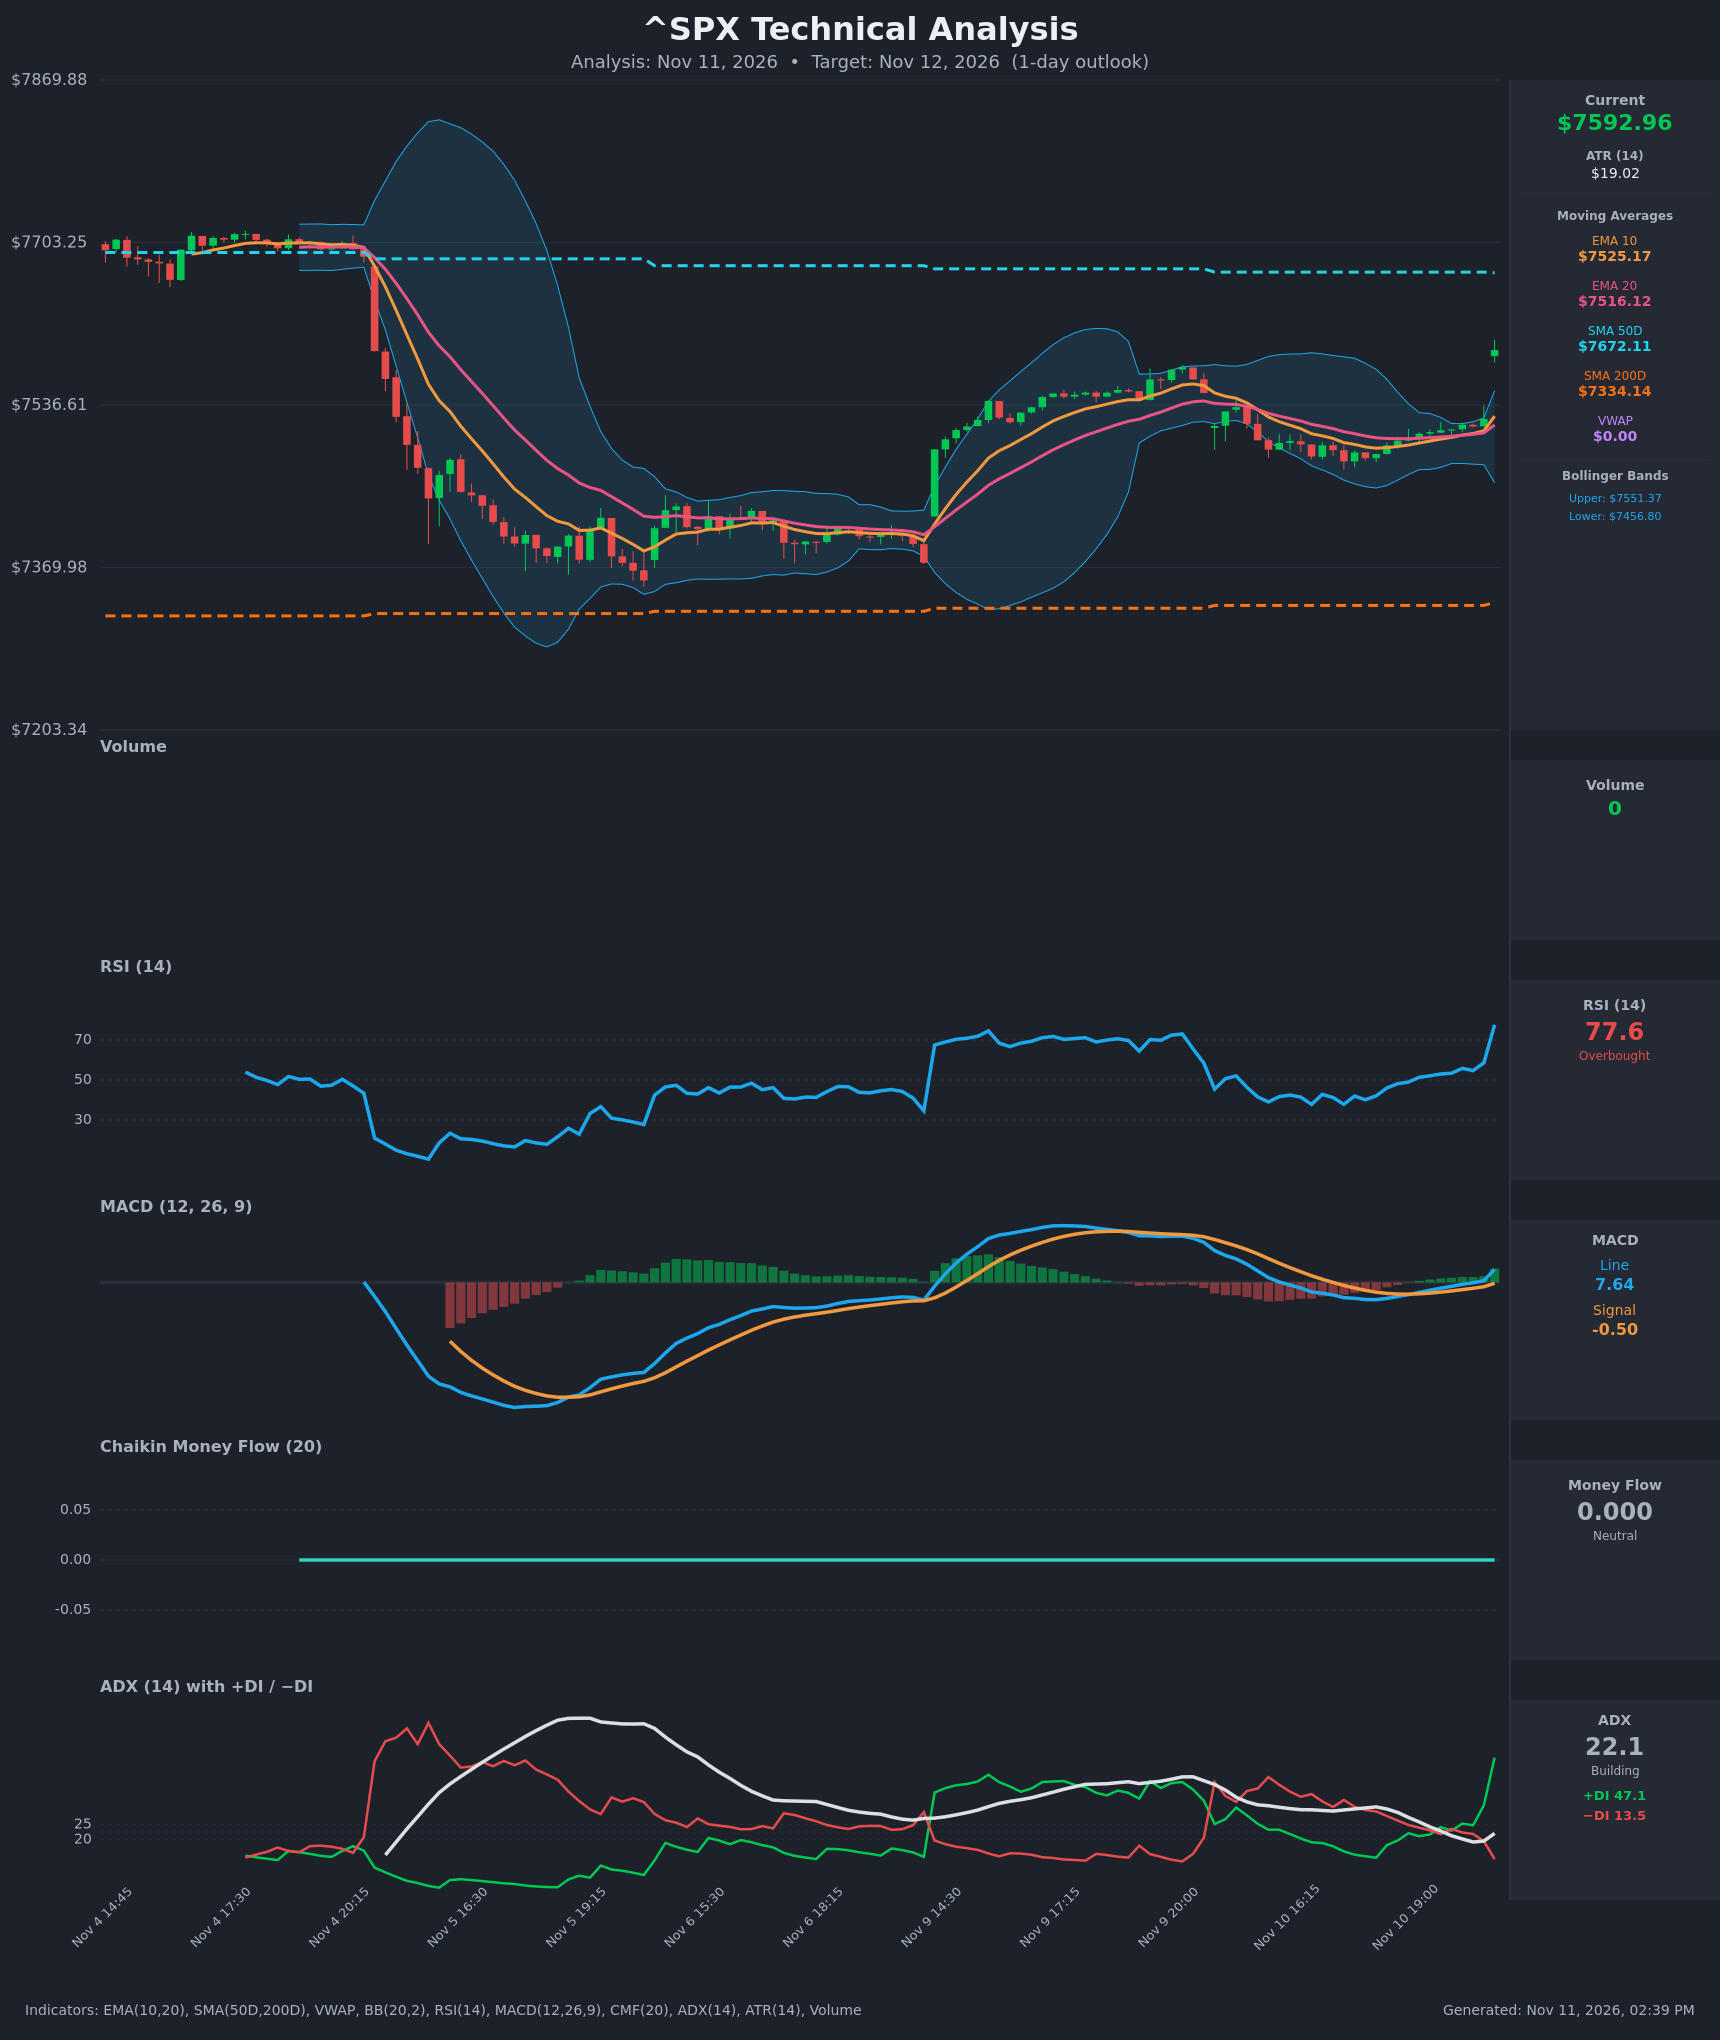
Analysis
TECHNICAL INDICATORS
- RSI (14): 77.6, well into overbought territory (>70). It jumped from about 58 to 77.6 in a single bar on the gap. Momentum is strong, but a reading this stretched usually invites a pause or pullback. [Bearish]
- 20 EMA: $7516.12, with the 10 EMA at $7525.17. Price at $7592.96 is about $77 (~1%) above the 20 EMA, roughly 4 ATR. The EMAs are curling up and the 10 EMA is above the 20 EMA, so the trend is positive. The distance from the EMAs makes the move extended, and the EMAs are the likely magnet on any pullback. [Bullish]
- MACD: Line 7.64 vs signal -0.50. The line crossed above the signal a few bars ago and has crossed above zero. The histogram is positive and expanding, a fresh bullish momentum signal. [Bullish]
- Bollinger Bands (20): Upper $7551.37, lower $7456.80. Price is about $41 above the upper band after a gap, a statistical extreme that tends to mean-revert or at least consolidate. The bands were narrow before the gap, so the move is a volatility-expansion breakout. [Bearish]
- CMF (20): 0.000, flat at zero across the whole series. This looks like a data limitation (zero volume) rather than a real reading, so it gives no confirmation either way. [Neutral]
- ADX (14): 22.1 and rising, with +DI at 47.1 far above −DI at 13.5. Bulls are clearly in control. The trend is only just building (ADX is below 25), so the DI spread reflects a sudden gap more than a sustained trend. [Weak/Building Trend, Bullish]
- Volume: Reported as 0, so there is no usable volume confirmation for the gap. Breakout conviction cannot be verified. [Neutral / Unconfirmed]
DIVERGENCES & TRENDS
- There is no classic divergence. RSI and MACD both made new highs with price. The RSI spike is a one-bar gap effect, not an organic climb.
- The MACD bullish crossover and the +DI/−DI flip are fresh. +DI crossed above −DI around Nov 10 19:45 and has since widened sharply.
- The EMA10/EMA20 bullish cross is confirmed and widening.
- Price is above SMA200 ($7334.14), so the long-term trend is up. It is still below SMA50 ($7672.11), which is overhead resistance about $79 above. The SMA50 is above the SMA200, so no death cross is in play.
- The gap leaves a hole between $7522 and $7593 that could attract a partial fill.
- Volatility expanded sharply from compressed bands, and price is now outside the upper band.
CHART PATTERNS
- Price spent the last sessions in a tight, converging range around $7500–$7525. This resembles a Bullish Pennant / Symmetrical Triangle, and it resolved upward with a gap breakout. A measured move would point higher, toward the SMA50 area near $7670.
- The earlier V-shaped recovery from the ~$7370 low is a rounded reversal. It does not match a specific diagram pattern.
- The breakout is a single-bar gap on unverifiable volume, with price stretched outside the Bollinger Band. A retest of the breakout zone ($7525–$7551) is a common follow-through behavior.
POTENTIAL SCENARIOS
- Scenario 1: Bearish Overbought Pullback / Partial Gap Fill — The gap is stretched well beyond the upper Bollinger Band with RSI near 78, so profit-taking pulls price back toward the upper band and the breakout zone. Trigger: failure to hold above ~$7600 early in the session, or a 15-minute close back below $7575. Target: $7551–$7565, with an extension to $7525 (EMA10). Invalidation: a sustained move above $7620. (45% probability)
- Scenario 2: Bullish Momentum Continuation — The pennant breakout follows through, with a fresh MACD cross and a dominant +DI. Dips are bought and price drifts toward the SMA50. Trigger: hold above $7580 and a break above the recent high near $7603. Target: $7625–$7670 (SMA50 at $7672). Invalidation: a close back below $7551. (40% probability)
- Scenario 3: Neutral Digestion — Price consolidates the gap in a tight band without resolving. Trigger: holds between $7565 and $7600 with fading momentum. Target: $7575–$7600. Invalidation: a break outside $7551–$7620. (15% probability)
PRICE TARGETS
Timeframe: 1 day (Nov 12, 2026). Range width check: $7650.00 − $7500.00 = $150.00, which is 1.98% of $7592.96. That fits a 1-day window, since the typical 2–3 day range is 2–4%.
- Target Price: $7565.00 (a mild pullback of about 0.4% toward the upper Bollinger Band and the breakout zone)
- Expected Range: $7500.00 to $7650.00
- Key Levels: Support at $7551.37 (upper Bollinger Band and breakout retest zone), Resistance at $7672.11 (SMA50)
OVERALL BIAS
OVERALL BIAS: BEARISH - Price is stretched about 4 ATR above the 20 EMA and outside the upper Bollinger Band with RSI near 78 after a single-bar gap, and volume cannot confirm the breakout. A modest pullback toward $7550–$7565 is slightly more likely than continuation. The upside case (MACD cross, dominant +DI, price above the SMA200) remains a close second, and a move above $7620 would invalidate this view.
This is educational analysis and not financial advice.