WMT 47-day bullish forecast — Oct 30, 2026
- Bias: Bullish
- Timeframe: 47 days (made Oct 30, 2026, target date Dec 16, 2026)
- Price at analysis: $123.64
- Price target: $127.50
- Expected range: $116.50 – $134.50
- Result: Pending — graded after the close on Dec 16, 2026
Get a free AI analysis of WMT today
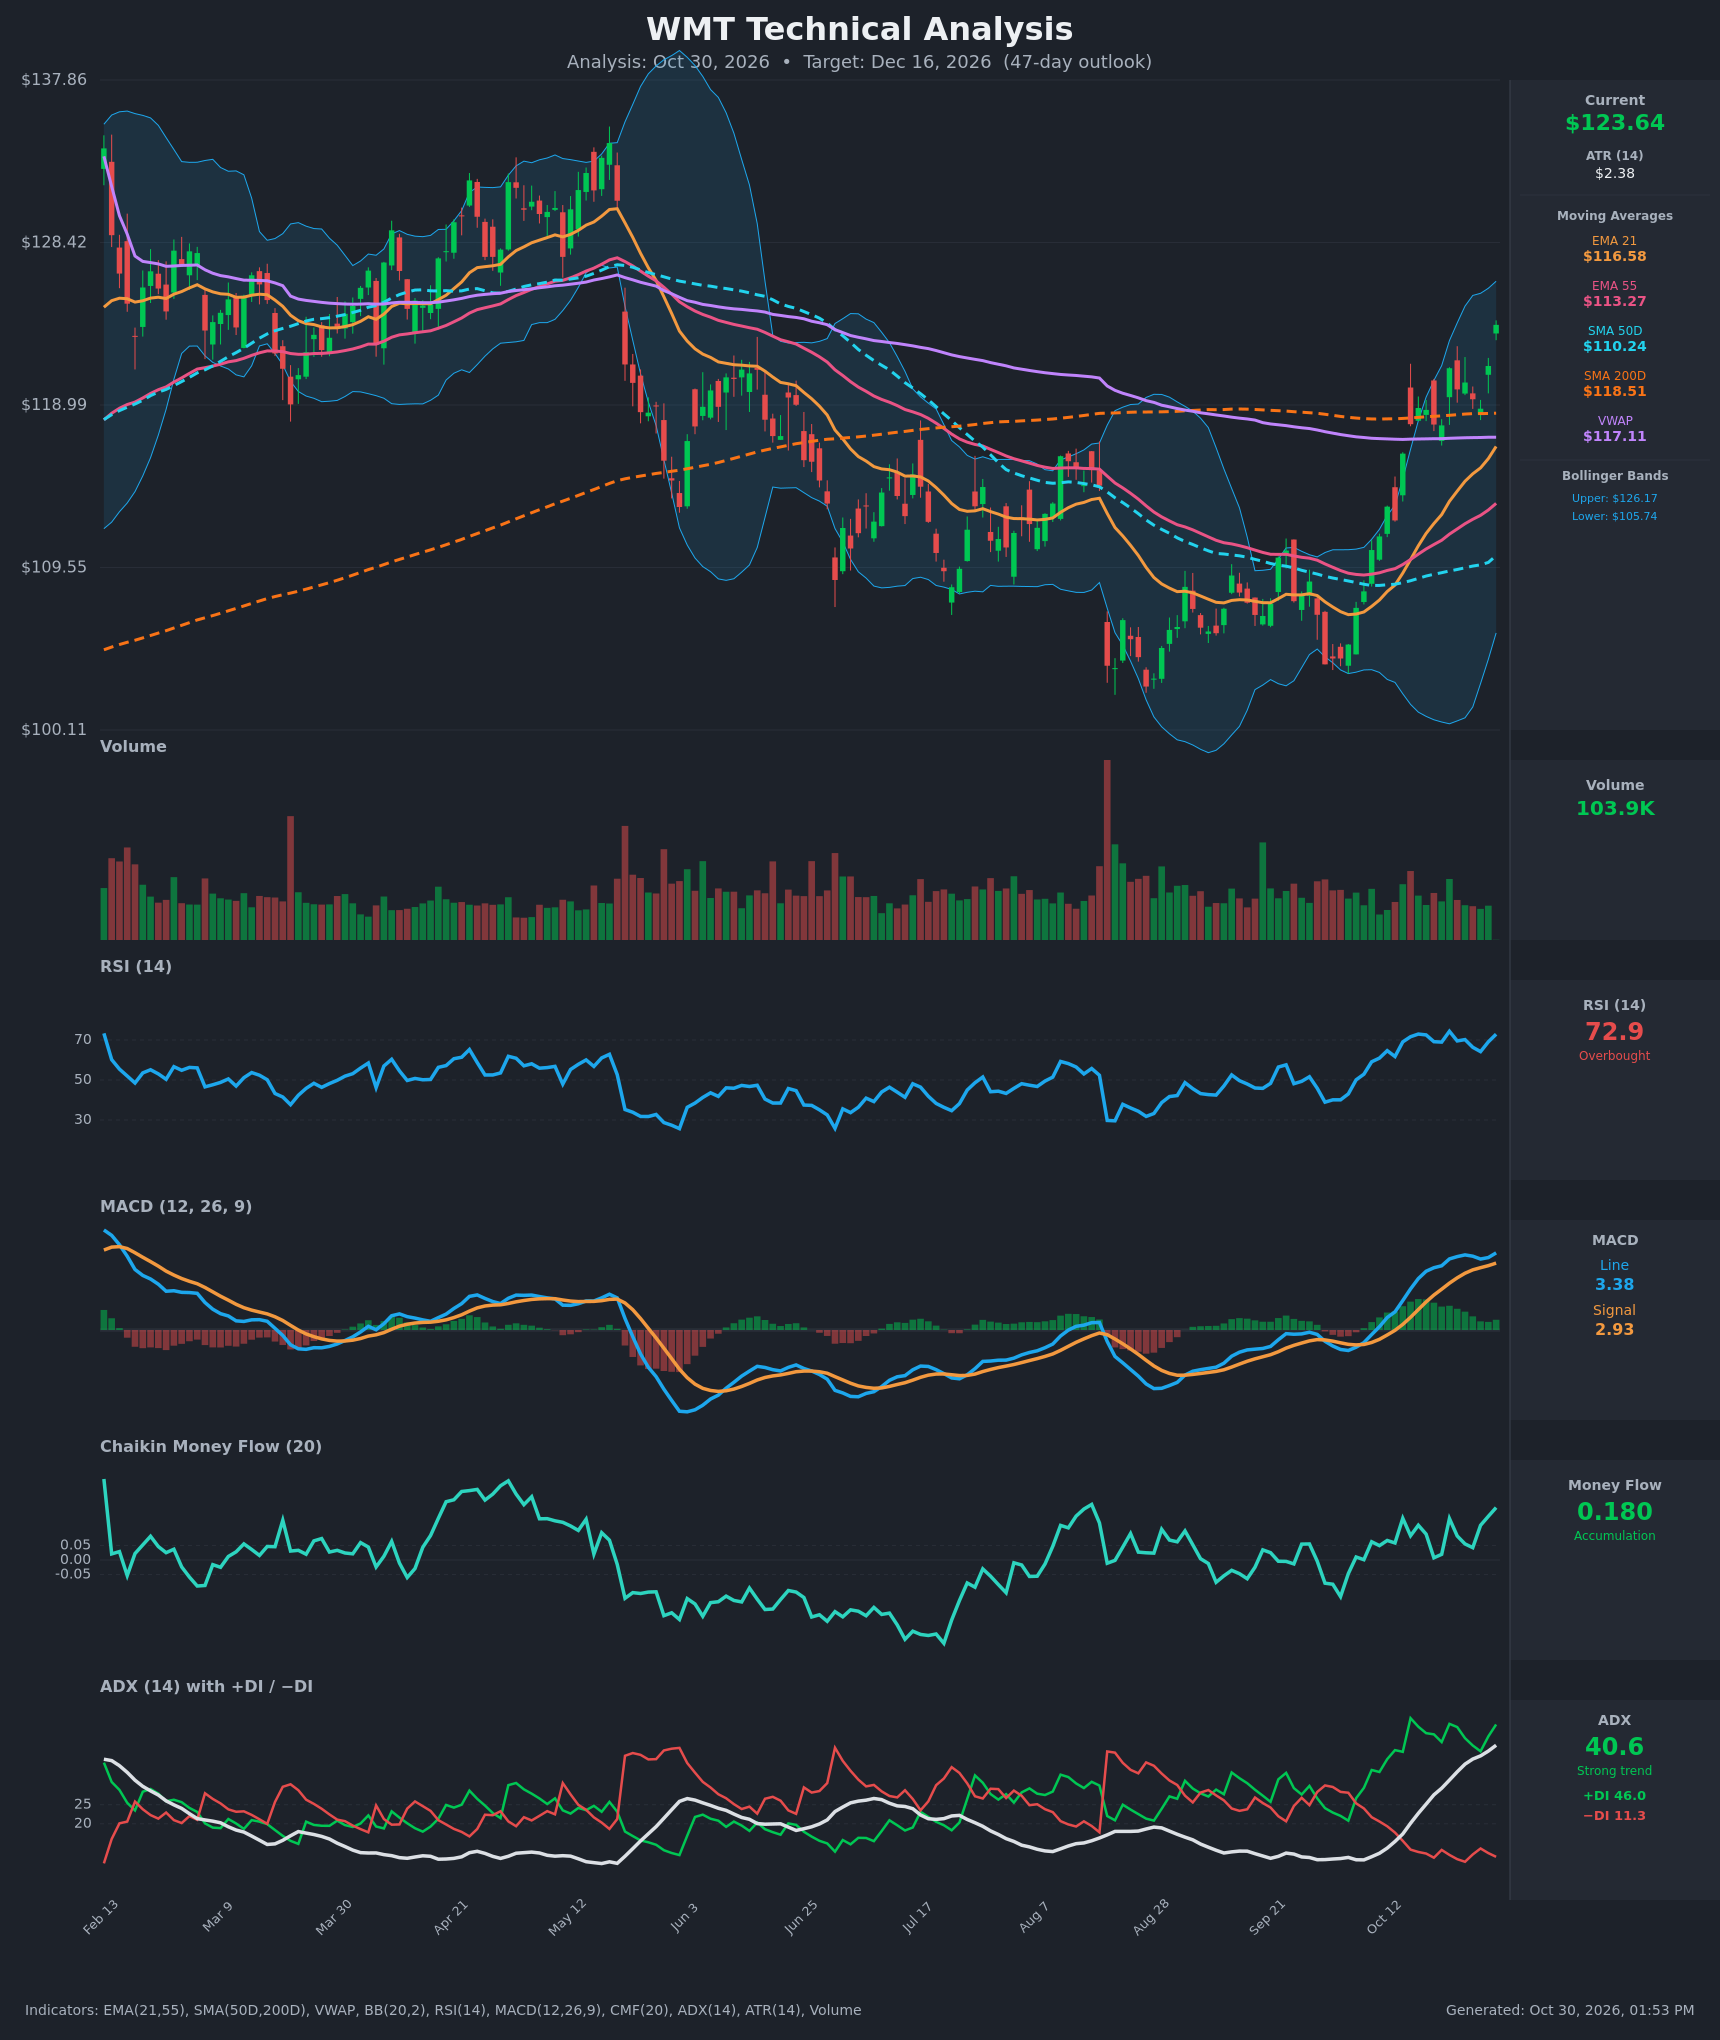
Analysis
TECHNICAL INDICATORS
- RSI (14): 72.9, overbought, and it has held between roughly 64 and 74 since Oct 14. It is making a strong, persistent push rather than rolling over, but it leaves little room before a pullback or pause. [Bullish] (short-term stretched)
- 20 EMA (EMA 21): $116.58, with price about 6% above it. EMA21 has crossed above EMA55 ($113.27) since Oct 15 and both are sloping up. The EMA21 is dynamic support on any pullback. [Bullish]
- MACD: Line 3.375 is above Signal 2.928 (positive histogram of about +0.45). The line crossed above the signal on Oct 13 and sits well above zero. The histogram is re-expanding after a brief dip on Oct 27-28. [Bullish]
- Bollinger Bands (20): Upper $126.17, lower $105.74. Price at $123.64 is in the upper quarter of the bands, about $2.5 below the upper band. The bands are widening after a long squeeze, which signals volatility expansion in the direction of the breakout. Overextension risk is modest rather than extreme. [Bullish]
- CMF (20): +0.180, well above +0.05 and rising, with readings positive since Oct 12. This is steady accumulation. [Accumulation]
- ADX (14): 40.6 and rising steadily from 13.6 on Oct 12. +DI (46.0) is far above −DI (11.3), so bulls are fully in control. A reading above 40 marks a very strong trend, but such readings can also precede consolidation. [Strong Trend – Bullish]
- Volume: 103.9K, which is average to below average on the volume panel. There was no climactic surge on the breakout, and green bars are slightly more frequent in the last two weeks. Participation is adequate but not exceptional, so the rally lacks high-volume confirmation. [Neutral to mildly supportive]
DIVERGENCES & TRENDS
- There is no bearish RSI or MACD divergence. RSI (72.9) and MACD (3.375) are both making new local highs along with price ($123.64 is the highest close in the table).
- The Oct 22 RSI peak (74.4) was higher than today's 72.9 while price is now higher. This is a minor RSI lower-high against higher price, but it is mild and not yet a meaningful divergence.
- ADX has risen for 15 straight bars and CMF has stayed positive. Trend strength and money flow confirm the price advance.
- Price is above EMA21, EMA55, SMA50D ($110.24), VWAP ($117.11) and SMA200D ($118.51). The reclaim of the SMA200D in mid-October is a major technical shift.
- The SMA50D ($110.24) is still below the SMA200D ($118.51), so there is no golden cross yet. The 50D is turning up and the gap is narrowing, which makes a golden cross a possible event in the coming months.
- EMA21 crossed above EMA55 on about Oct 15, a bullish medium-term crossover.
CHART PATTERNS
- Bullish Double Bottom (reversal): Price made lows of about $103-105 in September and early October. It then rallied through the $118-119 neckline area, which coincides with the SMA200D and the Aug-Sept highs. The measured move (neckline about $118.5 minus trough about $104 ≈ $14.5 height) projects to roughly $133. That is also near the May-June highs and is a long-term target, so the 47-day target is more conservative.
- Bullish falling-wedge-like base: Price compressed between the descending highs and the Sept lows before the squeeze released upward, consistent with the Bullish Falling Wedge reversal pattern.
- The Bollinger Band squeeze followed by an upside expansion supports the breakout. The first resistance is the upper band ($126.17), then the $128.4 horizontal level, then the May-June highs near $131-133.
POTENTIAL SCENARIOS
- Scenario 1: Bullish Trend Continuation — The ADX 40+ trend, +DI dominance and CMF accumulation keep driving price higher, with only shallow pullbacks to the EMA21 or the $120-121 area. Trigger: daily close above the upper Bollinger Band ($126.17) and then $128.40. Target: $128-$133 (double-bottom measured move near $133). Invalidation: daily close below $118.50 (SMA200D) with MACD crossing below its signal. (55% probability)
- Scenario 2: Bearish Overbought Pullback — RSI above 70 and an advance of about 20% from the lows lead to profit-taking. Price rejects the upper band and mean-reverts toward the EMA21 and VWAP, then probably consolidates. Trigger: bearish RSI divergence or a close below about $120 with the MACD histogram turning negative. Target: $116.50-$118.50 (EMA21/SMA200D/VWAP zone), extending to $113 (EMA55) if it fails. Invalidation: close above $126.50 on rising volume. (30% probability)
- Scenario 3: Neutral Consolidation — Price digests the rally between the SMA200D and the upper band, with RSI cooling to 55-60 while ADX plateaus. Trigger: tight closes between $119 and $126. Target: $120-$126. Invalidation: a close outside that range on above-average volume. (15% probability)
PRICE TARGETS
- Target Price: $127.50 (47 days, Dec 16, 2026)
- Expected Range: $116.50 to $134.50 (width $18.00, about 14.6% of current price, within the 12-18% guidance for 30-60 days)
- Key Levels: Support at $118.50 (SMA200D, with the EMA21 at $116.58 below it), Resistance at $126.17 (upper Bollinger Band, then $128.40 and $131-133)
OVERALL BIAS
OVERALL BIAS: BULLISH - A strong, confirmed uptrend (ADX 40.6, +DI 46.0 vs −DI 11.3), a MACD bull cross, positive CMF accumulation, a reclaim of the SMA200D and a double-bottom breakout favor further upside. Overbought RSI and below-average volume argue for a modest target and a possible pullback toward $118-$120 first.
This is educational analysis and not financial advice.