WMT 27-day bullish forecast — Nov 15, 2026
- Bias: Bullish
- Timeframe: 27 days (made Nov 15, 2026, target date Dec 11, 2026)
- Price at analysis: $128.09
- Price target: $132.00
- Expected range: $123.00 – $138.50
- Result: Pending — graded after the close on Dec 11, 2026
Get a free AI analysis of WMT today
Analysis
TECHNICAL INDICATORS
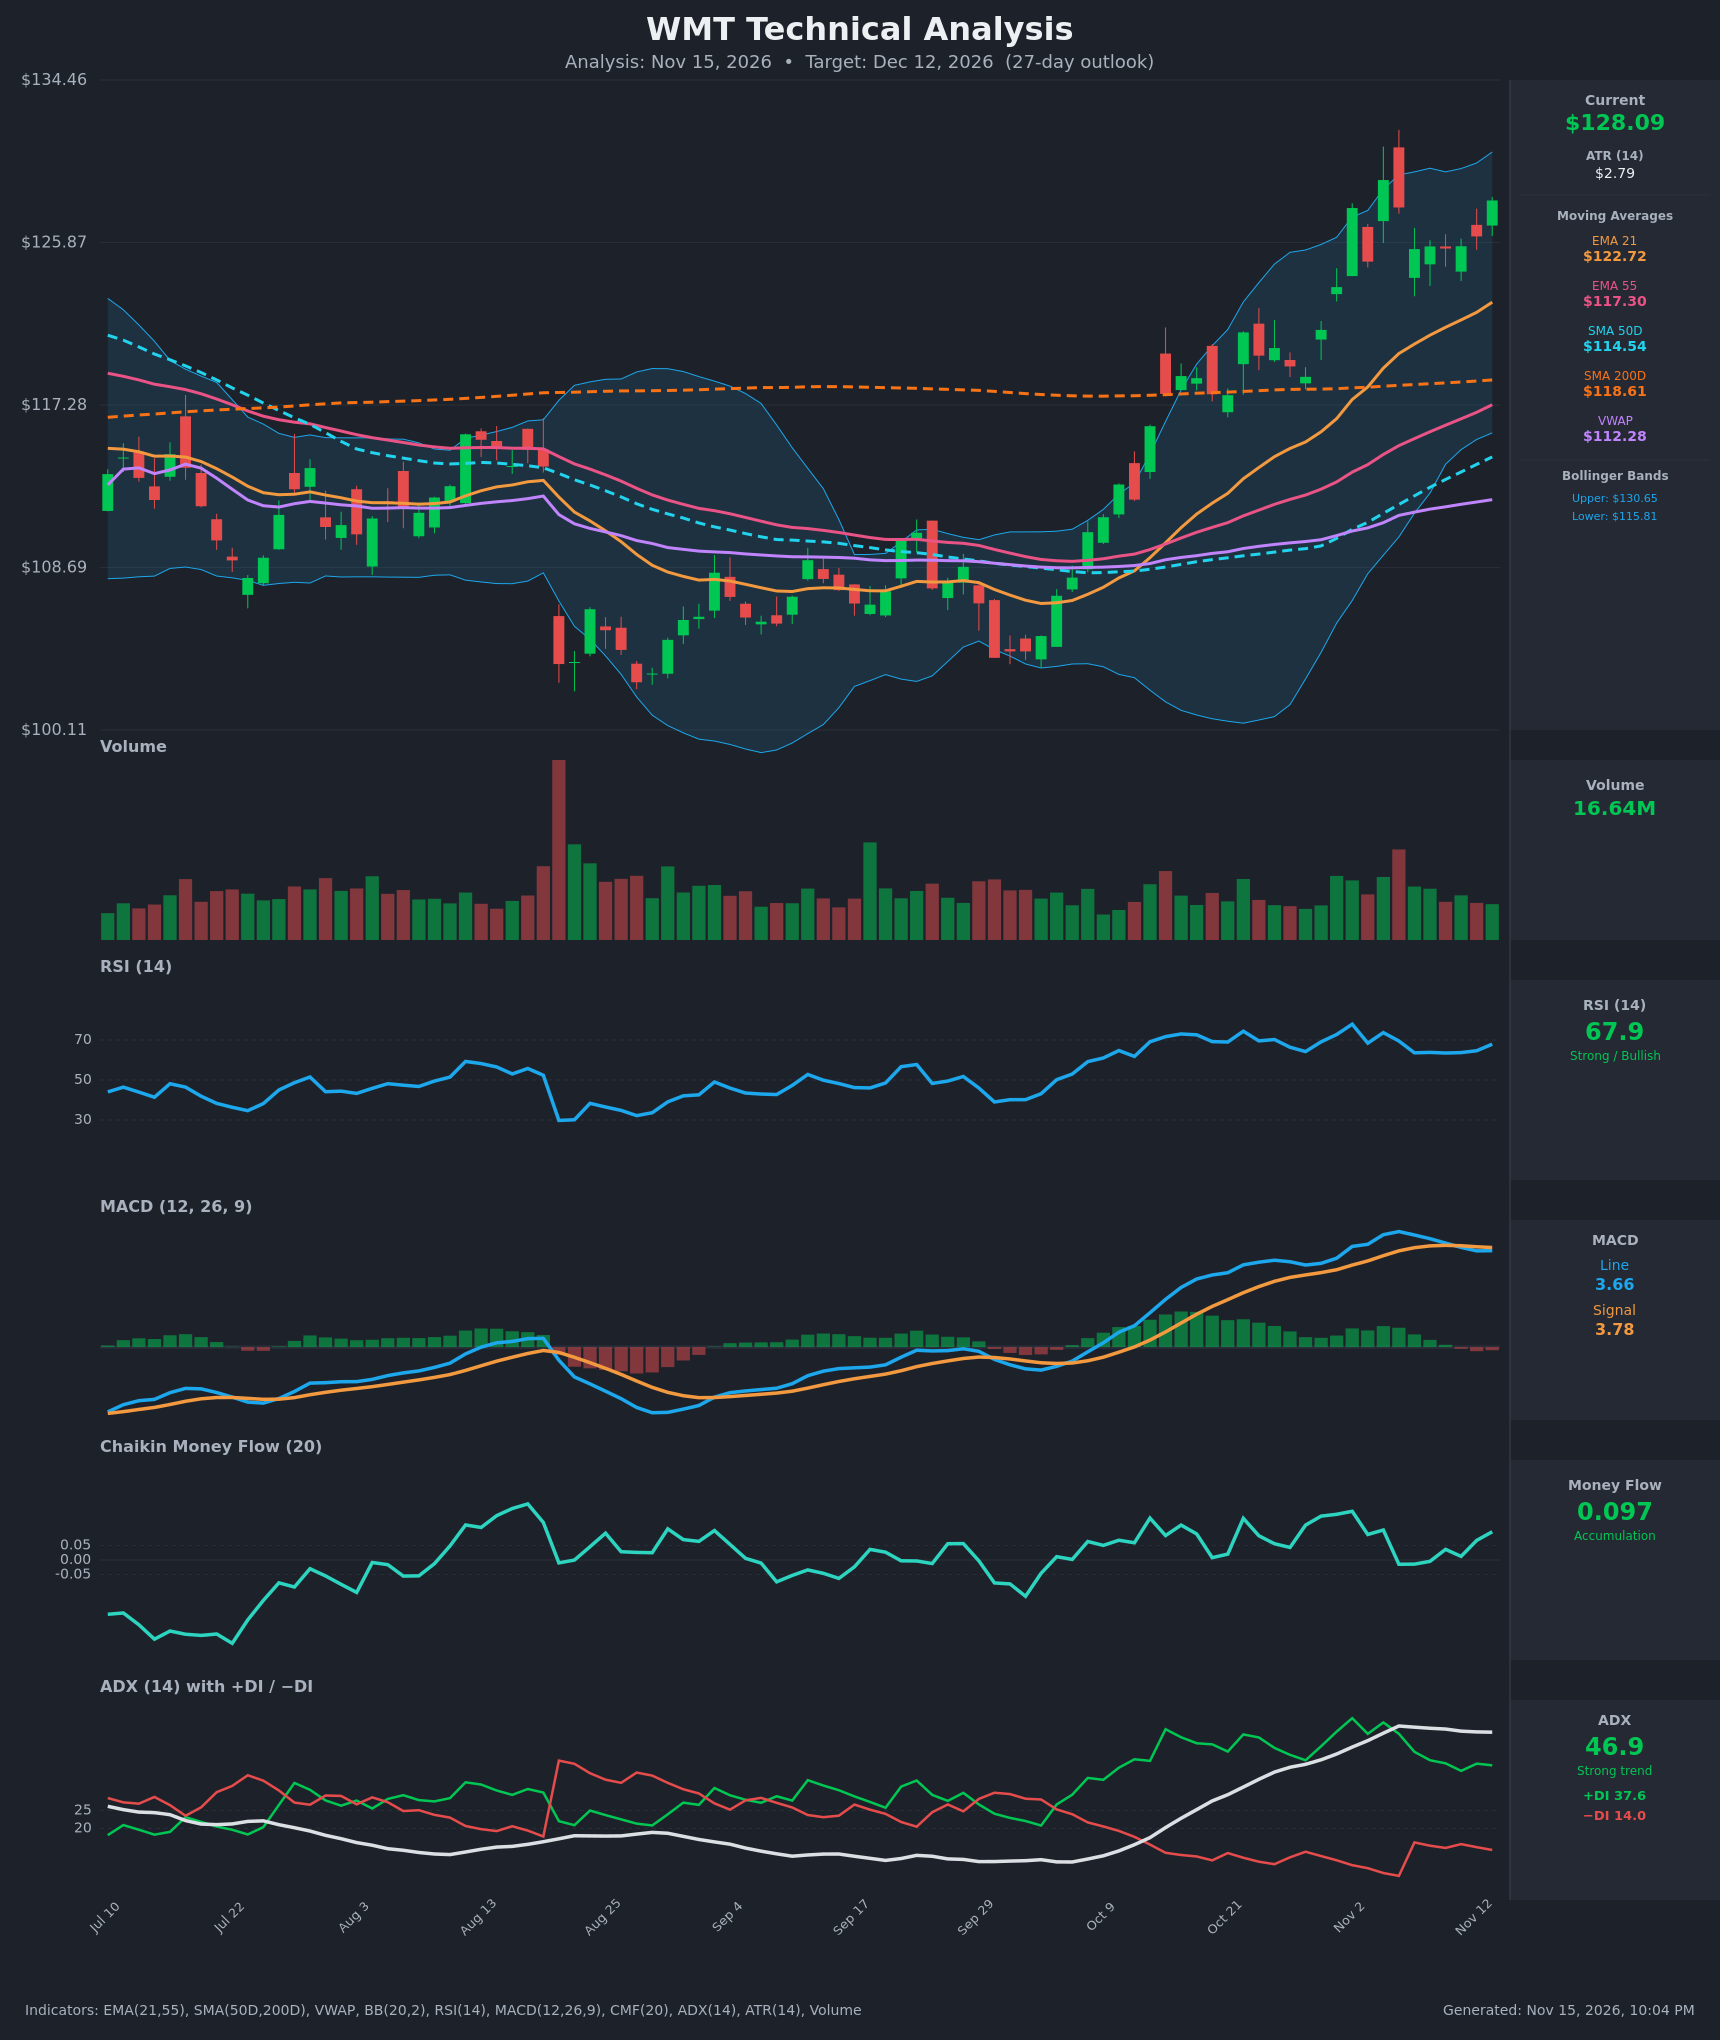
- RSI (14): 67.91, just under the 70 overbought line. It dipped to ~63.5 during the Nov 6–11 consolidation and is now turning up again, with a peak of 77.9 on Nov 2. Momentum is strong but not yet stretched. [Bullish]
- 20 EMA: The provided value is the EMA 21 at $122.72, about 4.4% below price. The EMA 21 is rising steeply and sits above the EMA 55 ($117.30), which is a bullish alignment. Price has held well above it throughout the consolidation, so it acts as dynamic support, with the first pullback zone near $122–123. [Bullish]
- MACD: Line 3.657 vs signal 3.776, so the histogram is slightly negative (about -0.12). A shallow bearish crossover occurred around Nov 11–12, but the line ticked up on Nov 13 (3.650 → 3.657) while the signal is flattening, so the cross is on the verge of reversing. Both lines remain well above zero. Momentum is cooling, not broken. [Neutral]
- Bollinger Bands (20): Upper $130.65, lower $115.81, middle ≈ $123.2. Price at $128.09 sits in the upper quarter of the bands. The bands are wide and expanding, and price has "walked" the upper band, a sign of trend strength rather than a reversal signal on its own. [Bullish]
- CMF (20): 0.097, above the +0.05 threshold. It slipped to slightly negative (-0.015) during the Nov 5–9 pullback but has recovered, showing renewed buying pressure on the latest advance. [Accumulation]
- ADX (14): 46.9 with +DI 37.6 and −DI 14.0. This is a very strong trend with bulls firmly in control. ADX is flat to slightly lower from its 48.6 peak, which suggests trend intensity is plateauing, so the pace of the advance may slow. [Strong Trend – Bullish]
- Volume: 16.64M, roughly average with no climactic spike. The consolidation was on light, mixed volume, and the Nov 4 spike came on a rejection candle. Volume does not confirm a breakout yet. [Neutral / Mildly Supportive]
DIVERGENCES & TRENDS
- MACD: The MACD line peaked on Nov 5 (4.38) while price made a marginal high on Nov 4 (129.17). Price is now about 0.8% below that high with a lower MACD, a mild bearish divergence. It is minor and could be erased by a new price high with a recovering MACD.
- RSI: RSI peaked at 77.9 on Nov 2 and has made lower highs since (73.7, 67.9). This is a mild momentum deceleration.
- Moving averages: The golden cross is already in place. SMA50D ($114.54) crossed above SMA200D ($118.61) in the sense that it is converging, but it is still below the SMA200D. The EMA21 > EMA55 alignment is intact. Price is above the SMA200D, which confirms a long-term uptrend after the August–September base.
- VWAP: Price is well above VWAP ($112.28), which shows buyer control.
- ADX/DI: +DI is well above −DI. The −DI spike to 16.1 on Nov 6 faded back to 14.0, so there is no bearish DI crossover.
- CMF: It is trending back above zero and the 0.05 threshold, which supports accumulation.
CHART PATTERNS
- Bullish Flag / Pennant (continuation): After the sharp rally from ~$118 to ~$129, price has consolidated in a tight $125–$129 band for about 7 sessions on declining volume. This resembles the Bullish Flag/Pennant in the reference. The measured move (pole ~$11 from $118 to $129) projects toward ~$136–140 on a breakout above $129.5–$131.
- Bearish Double Top (risk): Highs near $129.17 (Nov 4) and the retest around $128 form a possible double top. A close below the $125 neckline area would activate this reversal, with a target near $121–122, which lines up with the EMA21.
- Overall read: The continuation pattern is favored given the ADX and +DI strength, but the double-top risk is real if $125 breaks.
POTENTIAL SCENARIOS
- Scenario 1: Bullish Flag Breakout and Trend Continuation — Price consolidates, then breaks above the $129–$131 resistance cluster (previous high and upper Bollinger Band) with CMF staying positive and the MACD re-crossing up. Trigger: daily close above $131.00 on above-average volume. Target: $134–$137 (flag measured move partially realized). Invalidation: daily close below $124.50. (50% probability)
- Scenario 2: Bearish Pullback to EMA21 (Double Top Completion) — Fading momentum (MACD below signal, lower RSI highs) leads to a break of the consolidation low and mean reversion toward the rising EMA21. Trigger: daily close below $125.00. Target: $121.50–$123.00. Invalidation: reclaim of $129.50. (33% probability)
- Scenario 3: Neutral Range Digestion — Price continues to chop between about $124 and $131 while the ADX cools from its elevated level. Trigger: failure to close outside $125–$130 for most of the period. Target: $126–$129. Invalidation: close beyond $124 or $131.50. (17% probability)
PRICE TARGETS
- Target Price: $132.00 (27-day horizon)
- Expected Range: $123.00 to $138.50 (width $15.50, about 12.1% of current price, in line with the 27-day guidance)
- Key Levels: Support at $125.00 (consolidation low; below that is the EMA21 at $122.72), Resistance at $131.50 (recent wick high and upper Bollinger Band zone)
OVERALL BIAS
OVERALL BIAS: BULLISH - The trend is very strong (ADX 46.9, +DI 37.6 vs −DI 14.0). Price is above every key moving average and VWAP, CMF shows accumulation, and the tight consolidation resembles a bullish flag. The mild MACD and RSI deceleration and the proximity to the upper Bollinger Band argue for a modest target and a possible pullback to the EMA21 before the next leg higher.
This is educational analysis and not financial advice.