WMT 20-day bullish forecast — Nov 15, 2026
- Bias: Bullish
- Timeframe: 20 days (made Nov 15, 2026, target date Dec 4, 2026)
- Price at analysis: $128.09
- Price target: $131.50
- Expected range: $122.50 – $136.50
- Result: Pending — graded after the close on Dec 4, 2026
Get a free AI analysis of WMT today
Analysis
TECHNICAL INDICATORS
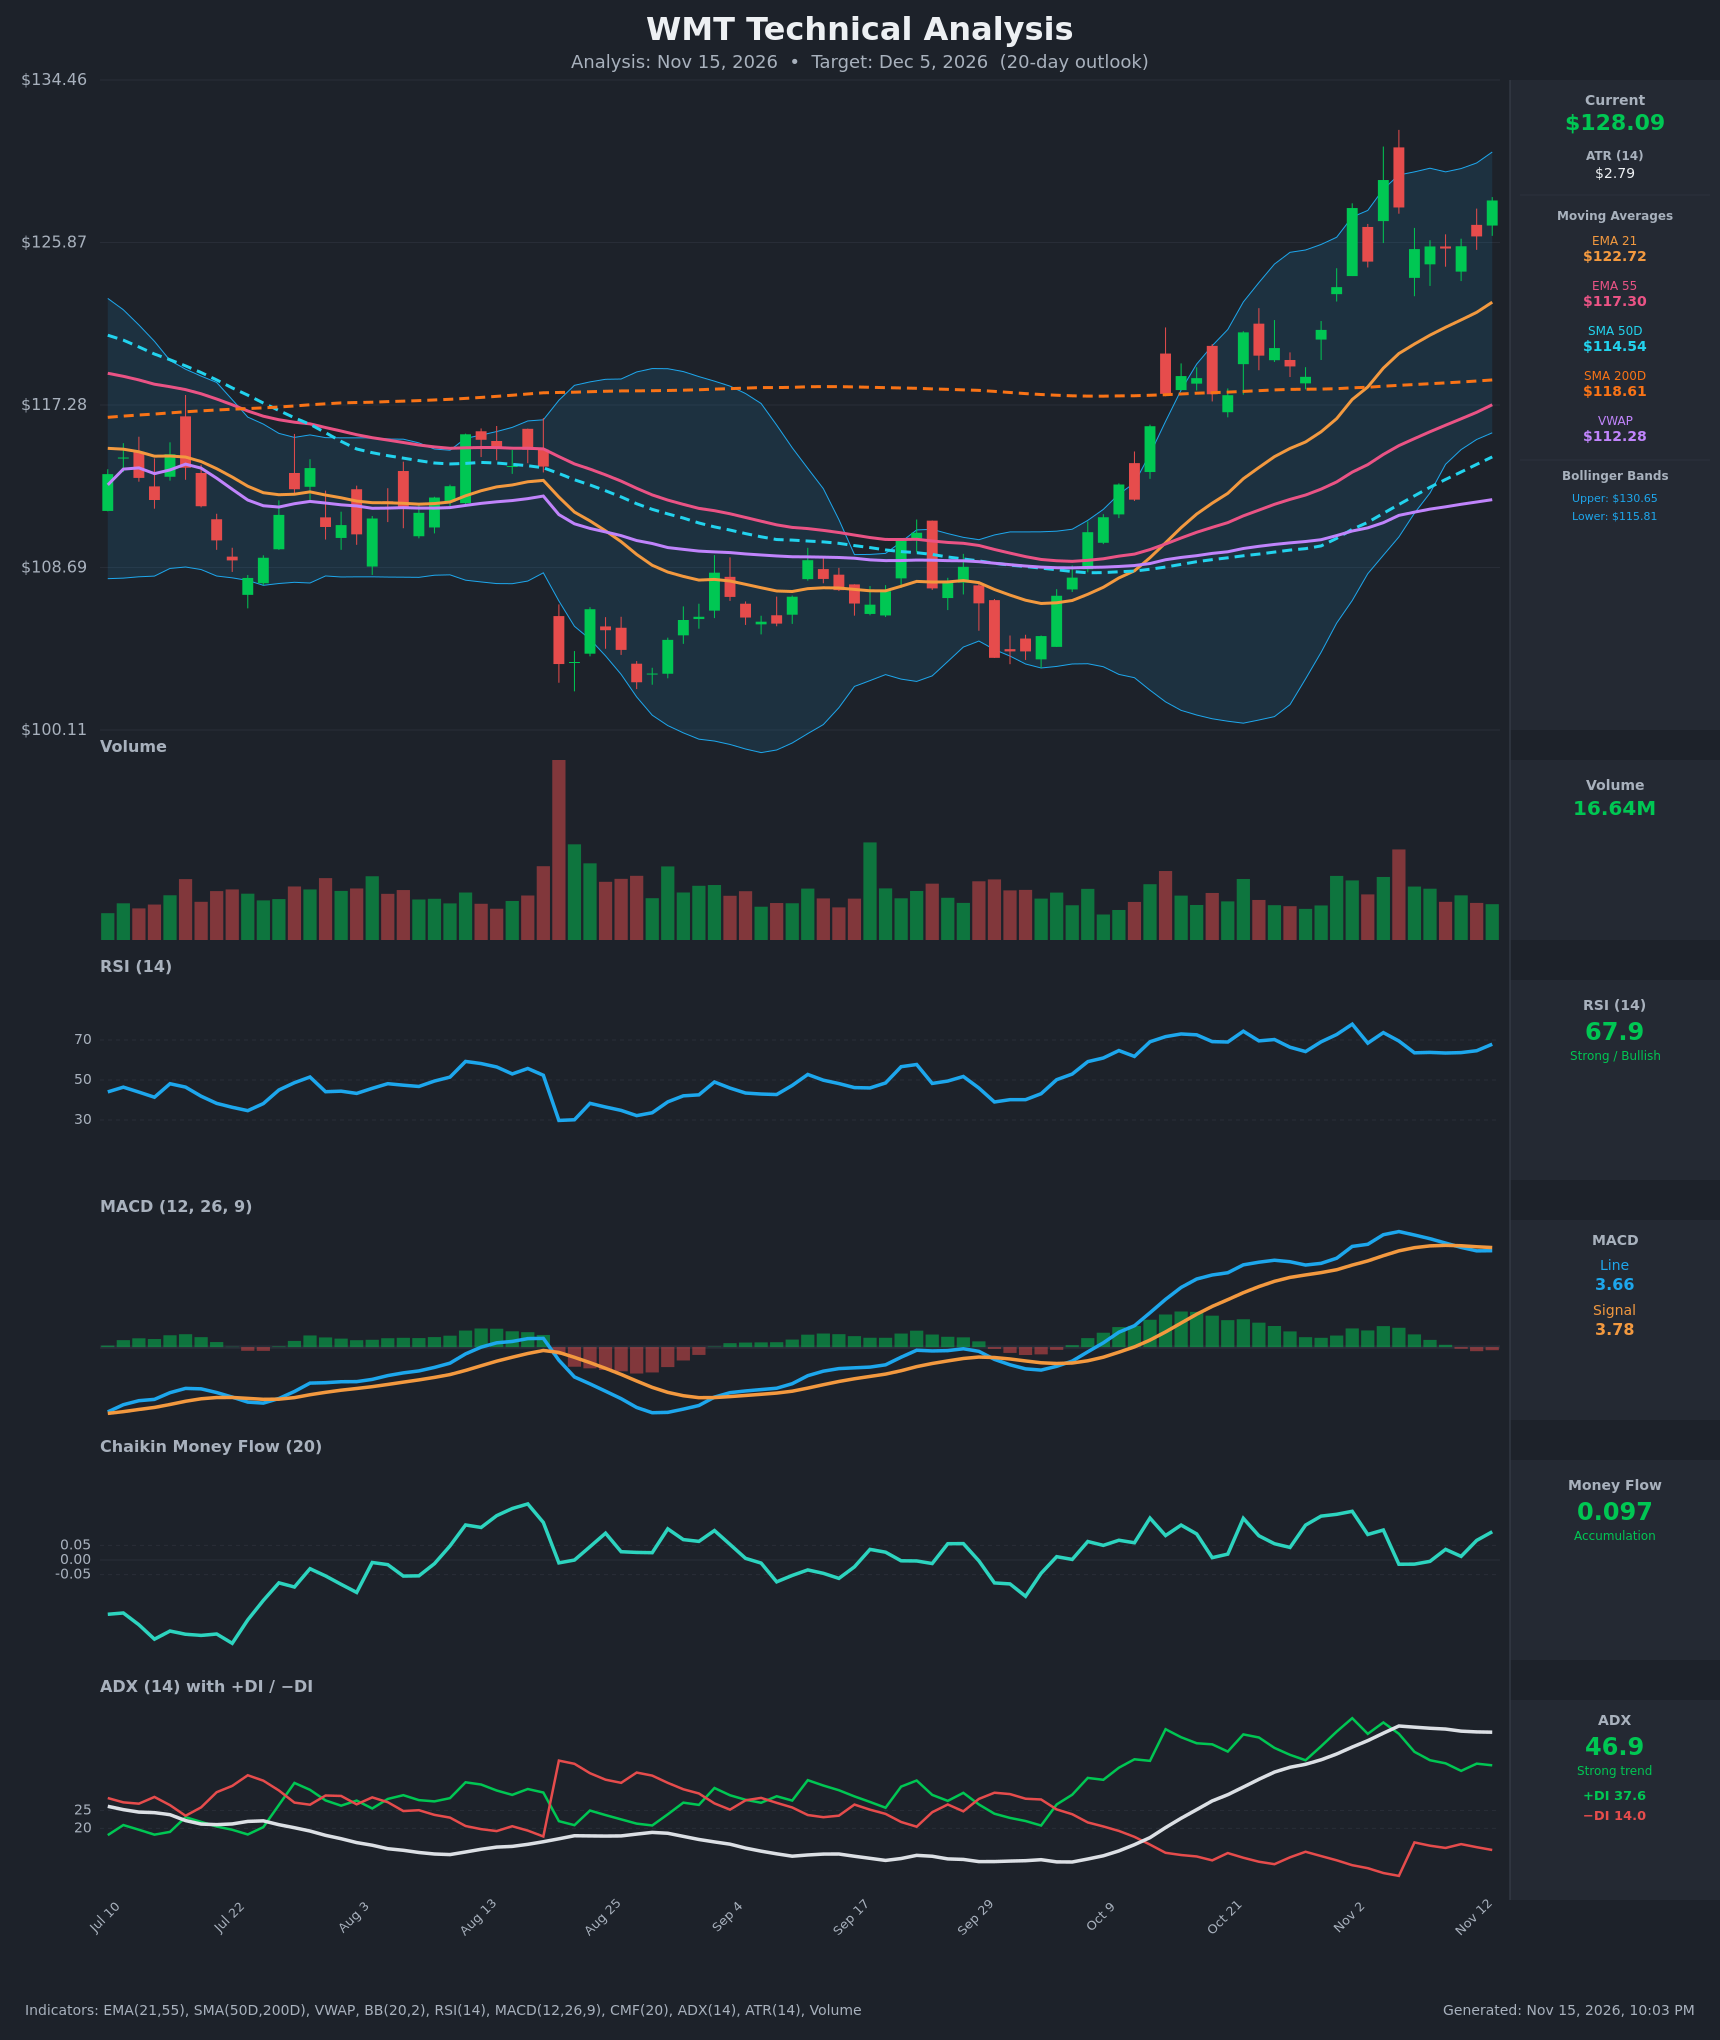
- RSI (14): 67.91, just under the 70 overbought line. It dipped to about 63.5 during the Nov 6–11 consolidation and is now turning back up, so momentum is strong but not yet stretched. [Bullish]
- 20 EMA (EMA 21): $122.72, with price about 4.4% above it. The EMA is rising steeply and EMA 21 sits well above EMA 55 ($117.30). Pullbacks toward it would be the first dynamic support. [Bullish]
- MACD: Line 3.657 vs. signal 3.776, so the line is just below the signal (about -0.12 histogram). The bearish cross happened Nov 11 and the histogram has gone slightly negative. The line is flattening at an elevated level, which shows momentum cooling after the sharp rally. The line ticked up from 3.650 to 3.657 on the latest bar and may be trying to turn back up. [Neutral]
- Bollinger Bands (20): Upper $130.65, lower $115.81, with price at $128.09 in the upper quartile of the band (about 83% of the width). The bands are expanding, and price has been walking the upper half since late October. That is a trend-strength signal, not a reversal one, though the upper band is a near-term cap. [Bullish]
- CMF (20): 0.097, above the +0.05 threshold and recovering from slightly negative readings (-0.015 on Nov 5–9). Buying pressure is returning, though not decisively. [Accumulation]
- ADX (14): 46.9 with +DI 37.6 vs. −DI 14.0. This is a very strong trend with bulls firmly in control. ADX is flat to slightly falling from a 48.6 peak, which suggests the trend is maturing and may consolidate. [Strong Trend – Bullish]
- Volume: 16.64M, near average on the latest bar and below the spike seen on the Nov 4–5 reversal bar. The rally lacks a heavy volume surge, but the up days are not being sold into on large volume. [Neutral-to-Mildly Bullish]
DIVERGENCES & TRENDS
- Price vs. RSI: Price made a higher high at $129.17 on Nov 4 while RSI peaked earlier at 77.9 (Nov 2). The current RSI of 67.9 is well below that peak even as price sits near the highs. This is mild bearish momentum divergence, not a confirmed signal.
- MACD: The bearish signal-line cross on Nov 11 is a caution flag, but it occurs high above zero and the histogram is only marginally negative. This looks like consolidation rather than trend failure.
- Moving averages: Price is above SMA200D ($118.61), SMA50D ($114.54), EMA 21, EMA 55 and VWAP ($112.28), a fully bullish stack. SMA50D ($114.54) is still below SMA200D ($118.61), so no golden cross has occurred yet. The gap is closing quickly (it was $8.6 apart on Oct 26 and is now $4.1), and a golden cross could occur within the 20-day window.
- ADX/DI: +DI has dominated −DI throughout. The DI spread narrowed from Nov 2 (50.8 vs. 9.7) but has stabilized, which is a healthy consolidation, not a bearish crossover.
- Trend: Price broke out of a two-month base (Aug–Oct low near $102–108) and cleared SMA200D in mid-October.
CHART PATTERNS
- Bullish Flag / Pennant (continuation): After the sharp impulse from about $118 to $129, price has been consolidating in a tight $124.9–$129.2 range over Nov 3–13 with a slight downward-to-flat drift. This matches the Bullish Flag/Pennant. A breakout above about $129.2 projects a measured move of roughly the flagpole (about $10), pointing toward $135–139 over a longer horizon.
- Possible minor Double Top: Highs at $127.69 (Nov 2) and $129.17 (Nov 4) with a minor dip between them could read as a short-term double top. A close below about $124.9 would validate it, with a pullback target near EMA 21 ($122.7). This is the less likely read given the very strong ADX.
- Base breakout: The longer-term pattern is a large rounded base (Aug–Oct) with a breakout through SMA200D.
- Significance: the trend is strong and the flag is the dominant read. Overbought RSI and the MACD cross suggest a pause is possible before continuation.
POTENTIAL SCENARIOS
- Scenario 1: Bullish Flag Breakout and Continuation — Price breaks above the Nov 4 high and the upper Bollinger Band, helped by CMF accumulation and a dominant +DI. The MACD re-crosses upward and a golden cross approaches. Trigger: daily close above $129.20 with volume above 18M. Target: $133–$135. Invalidation: close below $124.90. (50% probability)
- Scenario 2: Neutral-Bullish Consolidation Then Grind Higher — Price digests gains in the $124–$130 range, with EMA 21 rising to meet it, before resuming upward late in the window. Trigger: holds above $124.50 while the MACD flattens. Target: $129–$131. Invalidation: close below $122.70. (30% probability)
- Scenario 3: Bearish Pullback to EMA 21 and SMA200D — The MACD bearish cross and RSI divergence lead to profit-taking, and a double top below $129.20 confirms on a break of $124.90. Trigger: close below $124.90 on rising volume. Target: $120.50–$122.70. Invalidation: reclaim of $129.20. (20% probability)
PRICE TARGETS
For a 20-day horizon (roughly 4 trading weeks), the suitable range width is about 8–12% of price. The range below is $14.00 wide, about 10.9%.
- Target Price: $131.50 (about +2.7% from $128.09, consistent with flag-breakout drift and capped by the upper Bollinger Band near $130.65 and continued trend strength)
- Expected Range: $122.50 to $136.50 ($14.00 width, about 10.9%)
- Key Levels: Support at $124.90 (flag low and prior consolidation base; EMA 21 at $122.72 is the secondary support), Resistance at $129.17 (Nov 4 high; the next resistance is about $133–$135, the measured-move zone)
OVERALL BIAS
OVERALL BIAS: BULLISH - The trend is very strong (ADX 46.9, +DI 37.6 vs. −DI 14.0), and price sits above every major moving average, with CMF in accumulation and a bullish flag consolidating under $129.20. The MACD signal cross and the RSI divergence argue for a pause, but the evidence favors continuation toward $131–$135 over 20 days.
This is educational analysis and not financial advice.