WMT 34-day bullish forecast — Nov 15, 2026
- Bias: Bullish
- Timeframe: 34 days (made Nov 15, 2026, target date Dec 18, 2026)
- Price at analysis: $128.09
- Price target: $132.00
- Expected range: $119.50 – $138.00
- Result: Pending — graded after the close on Dec 18, 2026
Get a free AI analysis of WMT today
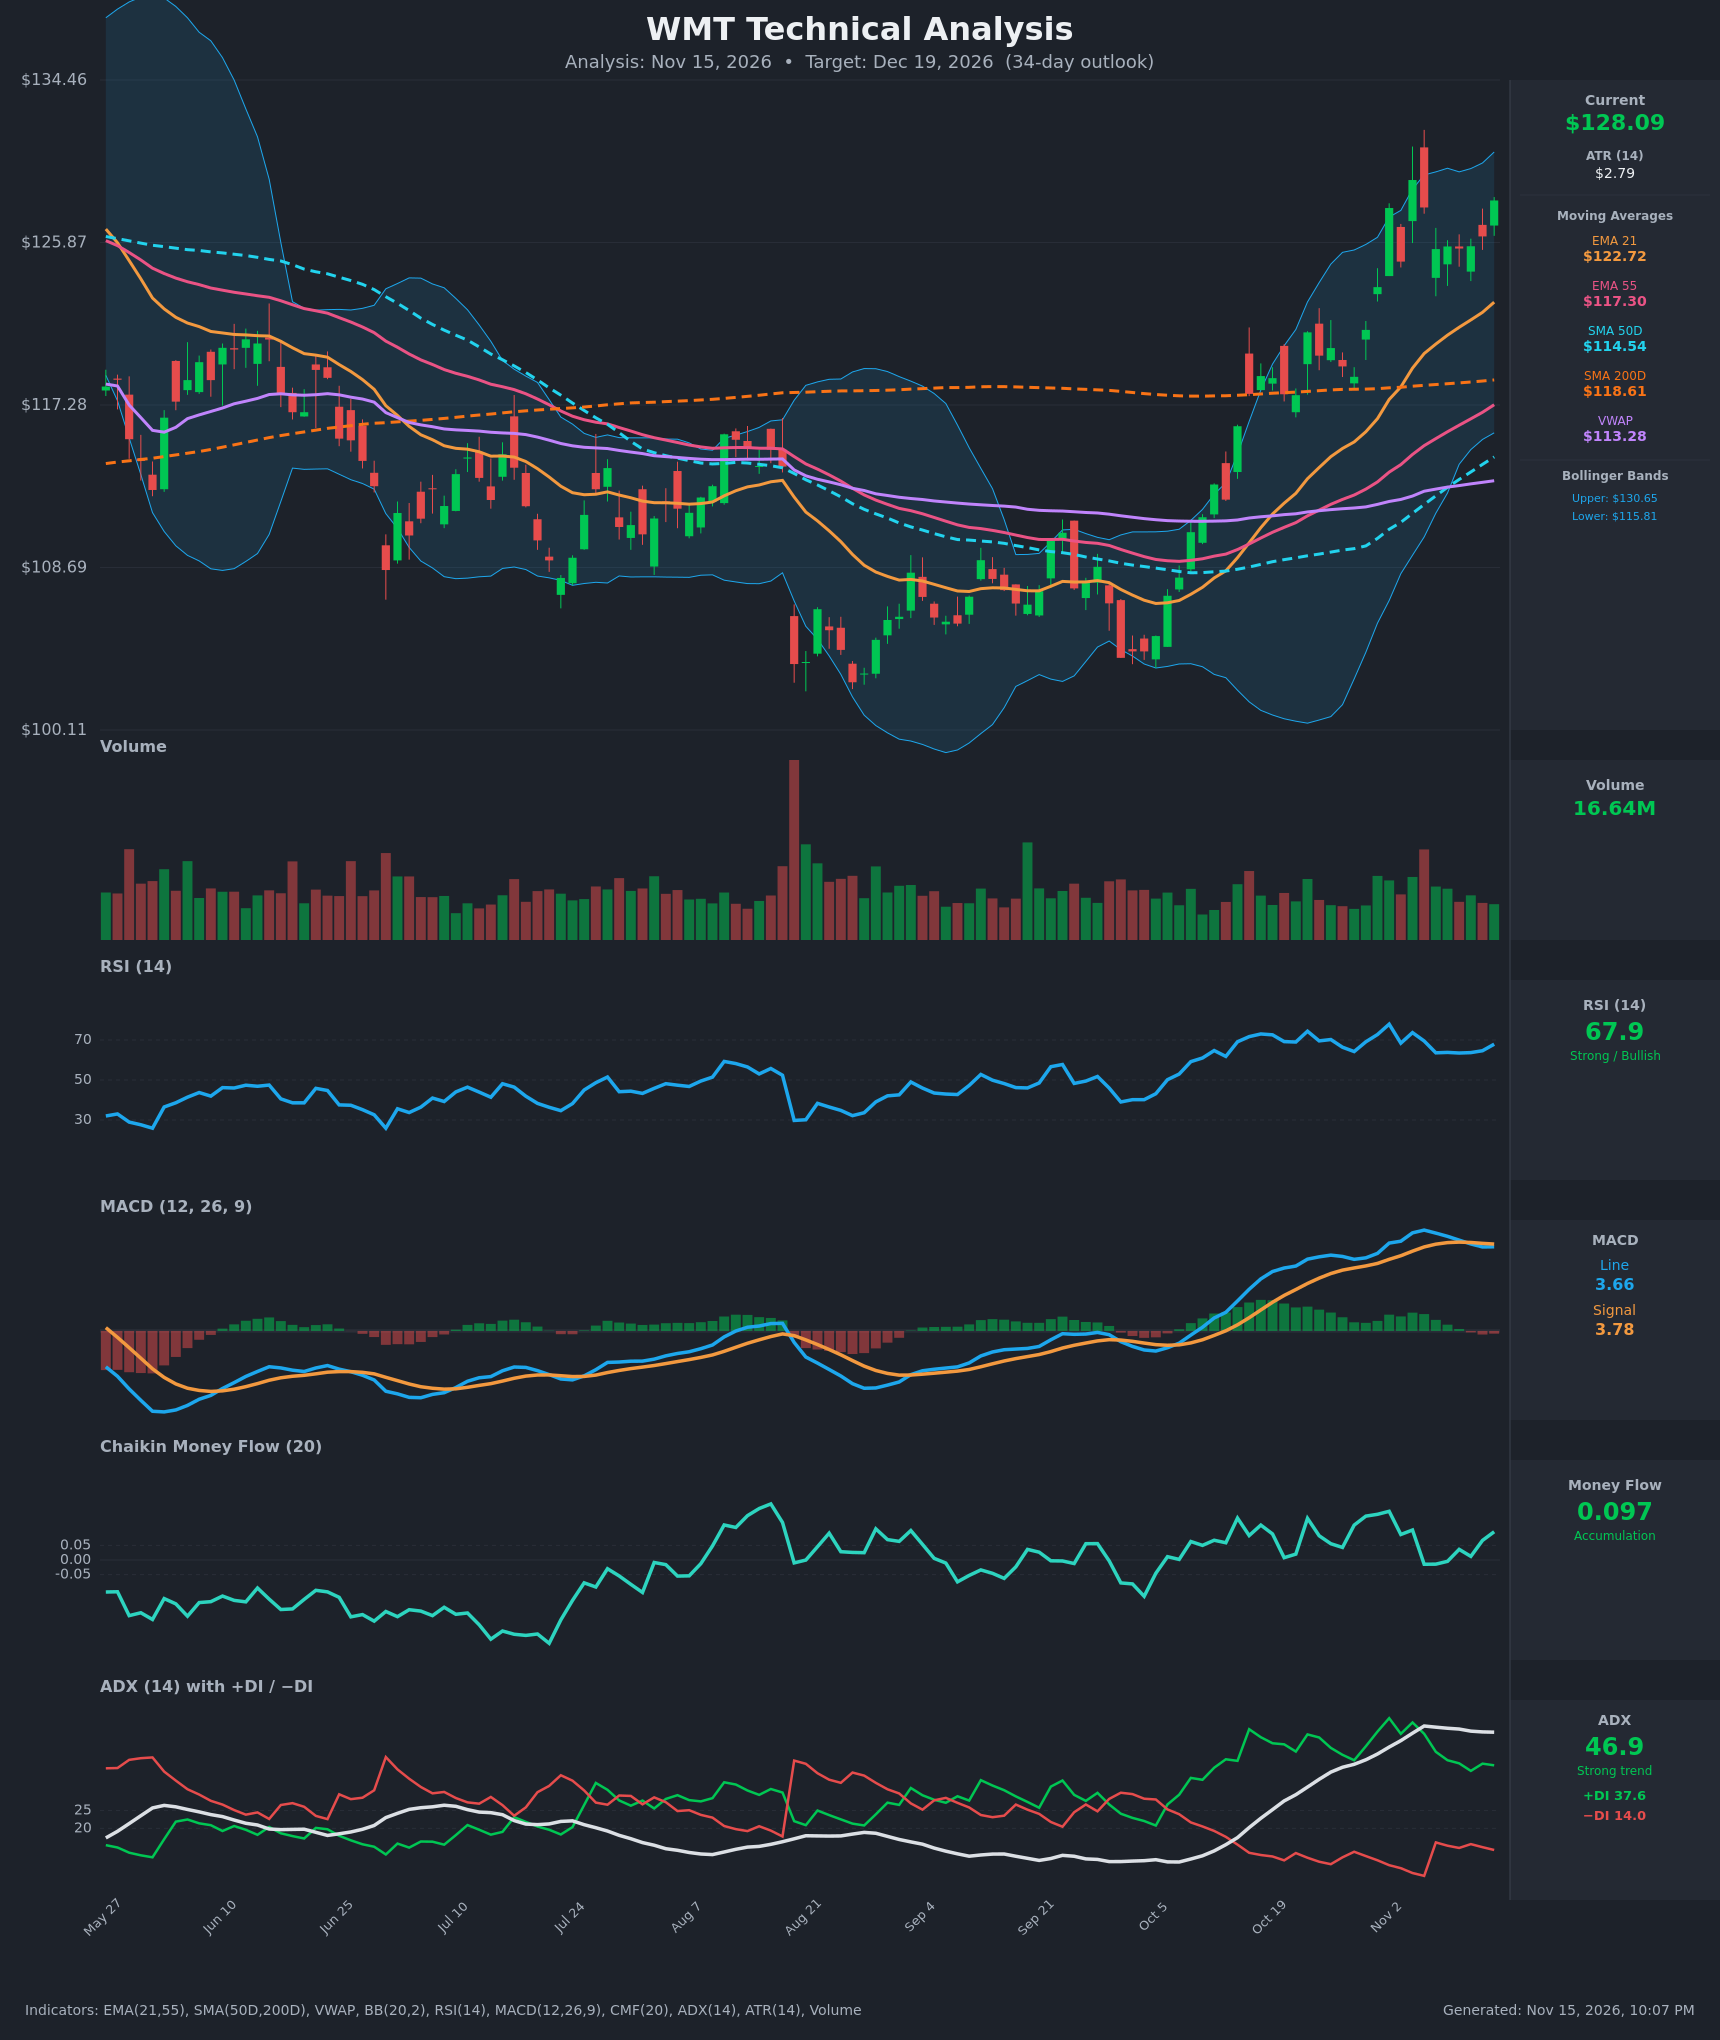
Analysis
TECHNICAL INDICATORS
- RSI (14): 67.91, just below the 70 overbought line. It has bounced from 63.5 to 67.9 over the last four sessions after peaking at 77.9 on Nov 2. Momentum is strong and rising again, but there is little room before overbought. [Bullish]
- 20 EMA: The data gives EMA 21 at $122.72, with price at $128.09 about 4.4% above it. The EMA is rising steadily and has acted as dynamic support during the consolidation. EMA21 is well above EMA55 ($117.30), so the stack is bullish. [Bullish]
- MACD: Line 3.657 vs signal 3.776. The line is slightly below the signal, so a mild bearish crossover occurred around Nov 12. The histogram is barely negative (about -0.12) and the line has just ticked up from 3.650 to 3.657, so the momentum fade looks to be stabilizing. Both lines remain well above zero. [Neutral]
- Bollinger Bands (20): Upper $130.65, lower $115.81, so price is in the upper third of the bands, about 0.83 of the band width. The bands are wide after the October breakout. The recent $129.17 high touched the upper band, and a pullback toward the middle band (about $123) is possible. [Bullish]
- CMF (20): 0.097, above the +0.05 threshold. It dipped slightly negative on Nov 5-6 and has recovered to mild accumulation. [Accumulation]
- ADX (14): 46.9, a very strong trend that is flattening near its peak. +DI at 37.6 is far above −DI at 14.0, so bulls are firmly in control. An ADX this high often precedes consolidation, since the trend is mature. [Strong Trend + Bullish]
- Volume: 16.64M, which looks average to slightly below average. The rally from October was on decent volume, but the recent consolidation is on lighter volume. That suggests a healthy pause rather than distribution. [Neutral to Mildly Bullish]
DIVERGENCES & TRENDS
- MACD: Price made a high at $129.17 on Nov 4, and MACD peaked at 4.38 on Nov 5. Price is now near that high at $128.09 while MACD is lower at 3.66. This is a mild bearish divergence in momentum.
- RSI: RSI peaked at 77.9 on Nov 2 and is now 67.9 with price near the highs. This is a mild momentum lag, not a confirmed divergence.
- Moving averages: The golden cross is pending. SMA50D ($114.54) is still below SMA200D ($118.61) but is rising by about $0.40 a day. The gap is about $4.07, so a golden cross could occur in roughly 10-14 trading days if price holds. Price has reclaimed SMA200D, which turns the long-term trend bullish.
- Trend: Price is above VWAP ($113.28), EMA21, EMA55, SMA50D and SMA200D. This is a full bullish alignment, and EMA21 crossed above EMA55 long ago.
- ADX/DI: +DI has stayed well above −DI since the October breakout. ADX is flat to slightly down, signaling a trend that is maturing.
CHART PATTERNS
- Bullish Flag / Pennant (continuation): After the sharp October-November advance from about $106 to $129, price has consolidated in a tight range of $124-$129 for about 8 sessions with higher lows. This resembles a bullish flag or pennant. A breakout above $129.17 would give a measured-move target near $135-$140 (the pole is about $20, so the full measure is higher and a partial measure is more realistic).
- Failed Double Top risk: The $129.17 and $128-129 highs form a minor double-top-like structure. A break below $124.50 would invalidate the flag and point toward the EMA21 near $123 and the middle Bollinger Band.
- Base breakout: The multi-month base from August to October lows around $103-$108 has resolved upward. This supports the bullish bias.
POTENTIAL SCENARIOS
- Scenario 1: Bullish Flag Breakout and Trend Continuation — Price holds above the rising EMA21, resolves the consolidation upward, and the pending golden cross adds momentum. Trigger: close above $129.20 with volume above 18M. Target: $134-$136. Invalidation: daily close below $122.50. (50% probability)
- Scenario 2: Neutral Consolidation Within the Range — The mature ADX and MACD fade lead to a sideways grind between EMA21 support and the upper Bollinger Band. Trigger: repeated failures at $129-$130 and holds at $123-$124. Target: $126-$129. Invalidation: close above $130.65 or below $122. (28% probability)
- Scenario 3: Bearish Pullback to the Mean — The bearish MACD crossover and RSI/MACD divergence trigger profit-taking toward the 21 EMA and beyond. Trigger: close below $124.50. Target: $119-$122, which tests the SMA200D. Invalidation: reclaim of $128. (22% probability)
PRICE TARGETS
For a 34-day horizon, the range width should be ~12-18% of price (about $15.4-$23).
- Target Price: $132.00
- Expected Range: $119.50 to $138.00 (width $18.50, or about 14.4% of the current price, consistent with the 30-60 day guidance)
- Key Levels: Support at $122.72 (EMA21), with deeper support at $118.61 (SMA200D). Resistance at $130.65 (upper Bollinger Band), then $134.46.
OVERALL BIAS
OVERALL BIAS: BULLISH - Price is above all key moving averages with ADX at 46.9, +DI far above −DI, CMF in accumulation and a pending golden cross, and the flag-like consolidation favors upside continuation. Mild MACD weakness and near-overbought RSI argue for a pullback or consolidation first, so conviction is moderate.
This is educational analysis and not financial advice.