WMT 48-day bullish forecast — Nov 15, 2026
- Bias: Bullish
- Timeframe: 48 days (made Nov 15, 2026, target date Jan 1, 2027)
- Price at analysis: $128.09
- Price target: $131.50
- Expected range: $119.50 – $138.00
- Result: Pending — graded after the close on Jan 1, 2027
Get a free AI analysis of WMT today
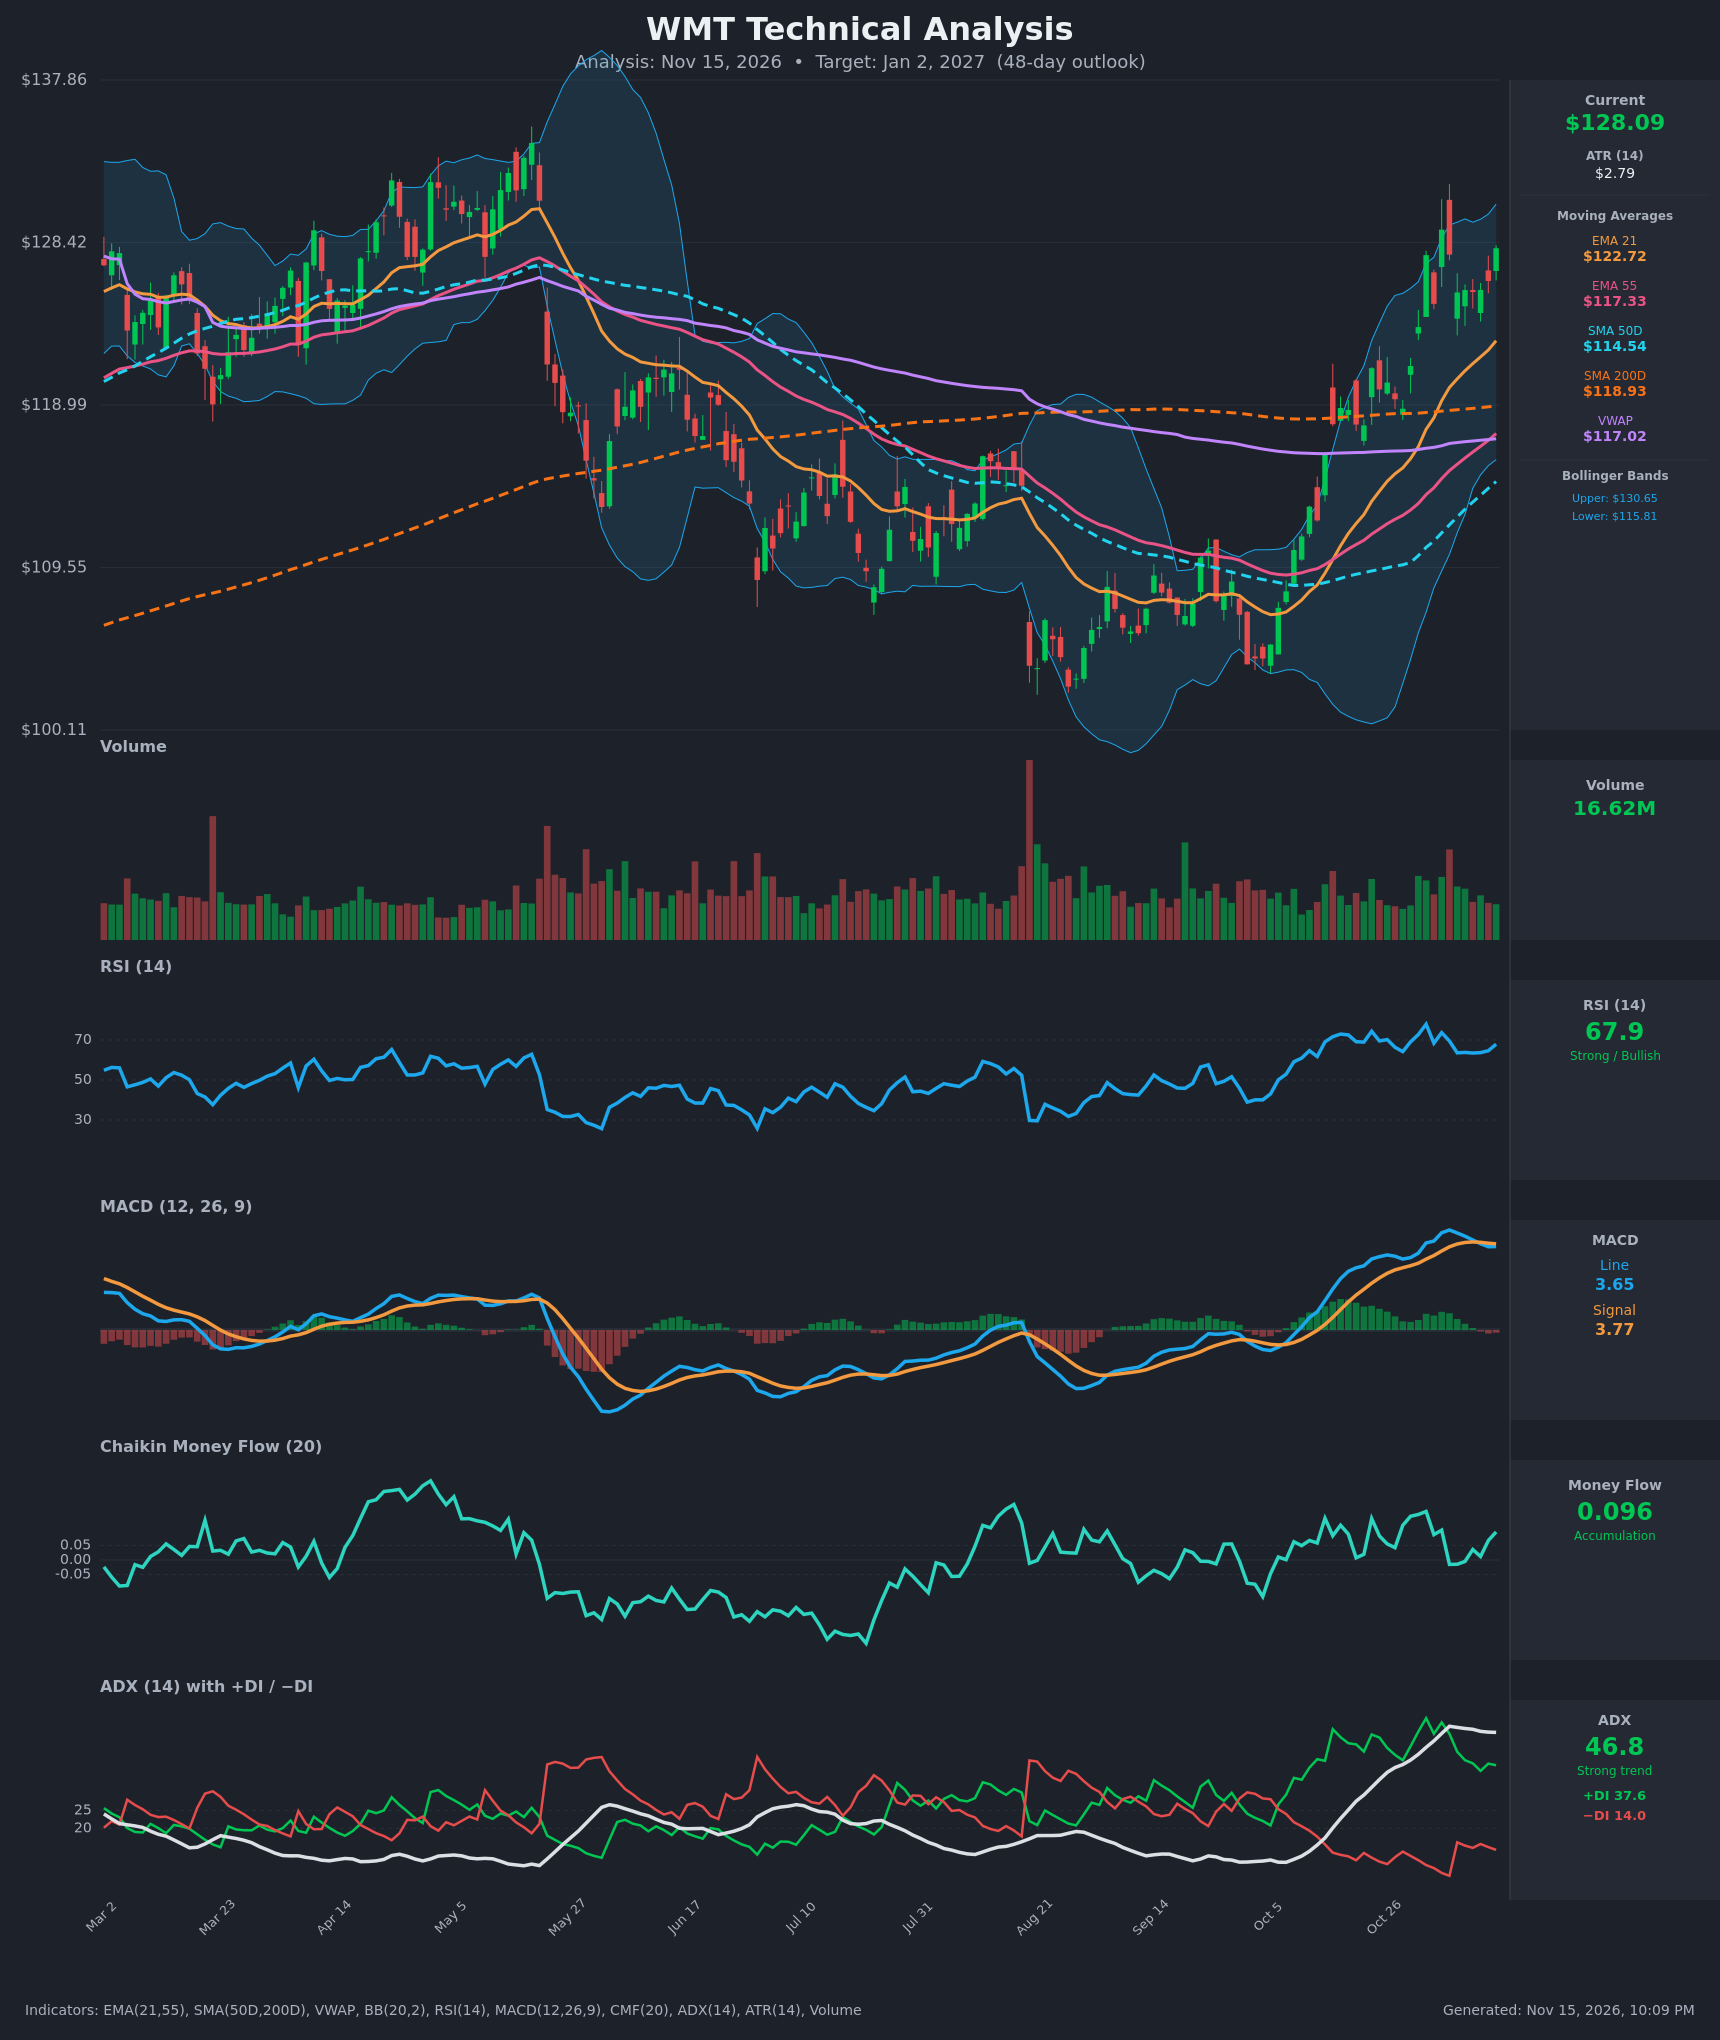
Analysis
TECHNICAL INDICATORS
- RSI (14): 67.9, just below the 70 overbought line. It has held in the 63-78 range for about three weeks and is turning up from 63.5. It peaked at 77.9 on Nov 2 and hasn't made a new high, so momentum is strong but a bit extended. [Bullish]
- 20 EMA (EMA 21): $122.72, with price at $128.09, about 4.4% above it. The EMA is rising steeply and has acted as dynamic support through the rally. EMA21 is also well above EMA55 ($117.33), and that gap is widening. [Bullish]
- MACD: Line 3.654 vs signal 3.772, a histogram of about -0.12. The line crossed below the signal around Nov 9-10 after peaking near 4.38 on Nov 5. This is a mild bearish crossover, but both lines sit well above zero and the line ticked up on the latest bar (3.647 to 3.654). That points to consolidation rather than a reversal. [Neutral]
- Bollinger Bands (20): Upper $130.65, lower $115.81, midline about $123.2. Price is in the upper quarter of the bands and has been riding the upper half since late October. The bands have expanded sharply after the squeeze in September-October. Price rejected near $129 twice (Nov 4 and the wick near $131), so the upper band is the nearby cap. [Bullish]
- CMF (20): 0.096, above the +0.05 threshold. It dipped slightly negative on Nov 5-6 and has recovered, so buying pressure is persistent but not heavy. [Accumulation]
- ADX (14): 46.8 with +DI 37.6 over −DI 14.0. This is a very strong trend, with the bulls clearly in control. ADX has rolled over slightly from 48.5, which often signals that the trend is maturing and a pause or consolidation is likely, not a reversal. [Strong Trend - Bullish]
- Volume: 16.62M, roughly average relative to the past several months. There is no climactic surge on the breakout, so the rally has been steady rather than blow-off. Up days have carried slightly better volume than down days. [Neutral to mildly Bullish]
DIVERGENCES & TRENDS
- Moving average structure: Price ($128.09) is above all key averages: EMA21 ($122.72), EMA55 ($117.33), SMA200 ($118.93), SMA50 ($114.54) and VWAP ($117.02). The price has reclaimed the SMA200 decisively, which is a major long-term trend shift.
- EMA crossover: EMA21 crossed above EMA55 in the recent past and the spread is widening, which is bullish. SMA50 ($114.54) is still below SMA200 ($118.93), but the gap is narrowing (about $4.4). A golden cross is plausible within the 48-day window if the trend holds.
- Mild bearish divergence: Price made a higher high at $129.17 (Nov 4), while RSI peaked at 77.9 on Nov 2 and MACD peaked on Nov 5. The latest price of $128.09 is slightly below that high, and the MACD line has crossed below its signal. This is a minor momentum cooling, not a full divergence.
- Trend in indicators: The DI spread is wide, but +DI has fallen from 50.8 to 37.6, and ADX is flattening. That suggests a shift from impulsive advance to consolidation.
- Extension: Price sits far above the 21 EMA and the SMA50, so a pullback to the $122-124 area is possible even within an uptrend.
CHART PATTERNS
- Base reversal: The September-October low near $102-104 formed a rounded or double-bottom type base (similar to the Bullish Double Bottom in the reference). The breakout above the $118-119 SMA200 and neckline area confirmed it. The measured move from a ~$103 low to the $118 neckline is about $15, which projects to roughly $133-134.
- Bullish flag / consolidation: Since Nov 4, price has traded sideways to slightly down between roughly $124.9 and $129.2 after a sharp advance. This is consistent with a Bullish Flag or Pennant continuation. A breakout above $129.2-$131 targets about $135-$138, the flagpole-projected zone.
- Resistance: The prior high near $133-$137 from May is the major overhead supply zone.
POTENTIAL SCENARIOS
- Scenario 1: Bullish Flag Breakout and Trend Continuation — Price holds above the EMA21 and breaks out of the $125-$129 consolidation, driven by the strong ADX and positive CMF. Trigger: daily close above $129.50-$131 with expanding volume. Target: $134-$137. Invalidation: close below $122 (EMA21 breakdown). (50% probability)
- Scenario 2: Neutral Consolidation Below Resistance — Price chops between $122 and $130 as ADX cools and the RSI resets. Trigger: repeated rejections near the $130.65 upper band with MACD hovering around the signal line. Target: $124-$130. Invalidation: close above $131 or below $121. (25% probability)
- Scenario 3: Bearish Pullback to Mean — Overextension plus the MACD bearish cross leads to a deeper retracement toward the EMA55/SMA200 zone. Trigger: close below $124.9 then below $122.7 EMA21. Target: $118-$120. Invalidation: reclaim of $128.5 on volume. (25% probability)
PRICE TARGETS
- Target Price: $131.50 (48-day horizon)
- Expected Range: $119.50 to $138.00. The width is $18.50, about 14.4% of the current price, in line with the 30-60 day guidance of 12-18%.
- Key Levels: Support at $122.72 (EMA21), with deeper support at $118.93 (SMA200). Resistance at $130.65 (upper Bollinger Band), then $134-$137 (prior highs).
OVERALL BIAS
OVERALL BIAS: BULLISH - Price has reclaimed all major moving averages including the SMA200, ADX is at 46.8 with +DI far above −DI, and CMF shows accumulation. The current consolidation looks like a bullish flag. The mild MACD cross and the extended RSI argue for a possible pullback first, but the trend favors continuation toward the low-to-mid $130s.
This is educational analysis and not financial advice.