WMT 83-day bullish forecast — Nov 15, 2026
- Bias: Bullish
- Timeframe: 83 days (made Nov 15, 2026, target date Feb 5, 2027)
- Price at analysis: $128.09
- Price target: $131.50
- Expected range: $116.00 – $142.00
- Result: Pending — graded after the close on Feb 5, 2027
Get a free AI analysis of WMT today
Analysis
TECHNICAL INDICATORS
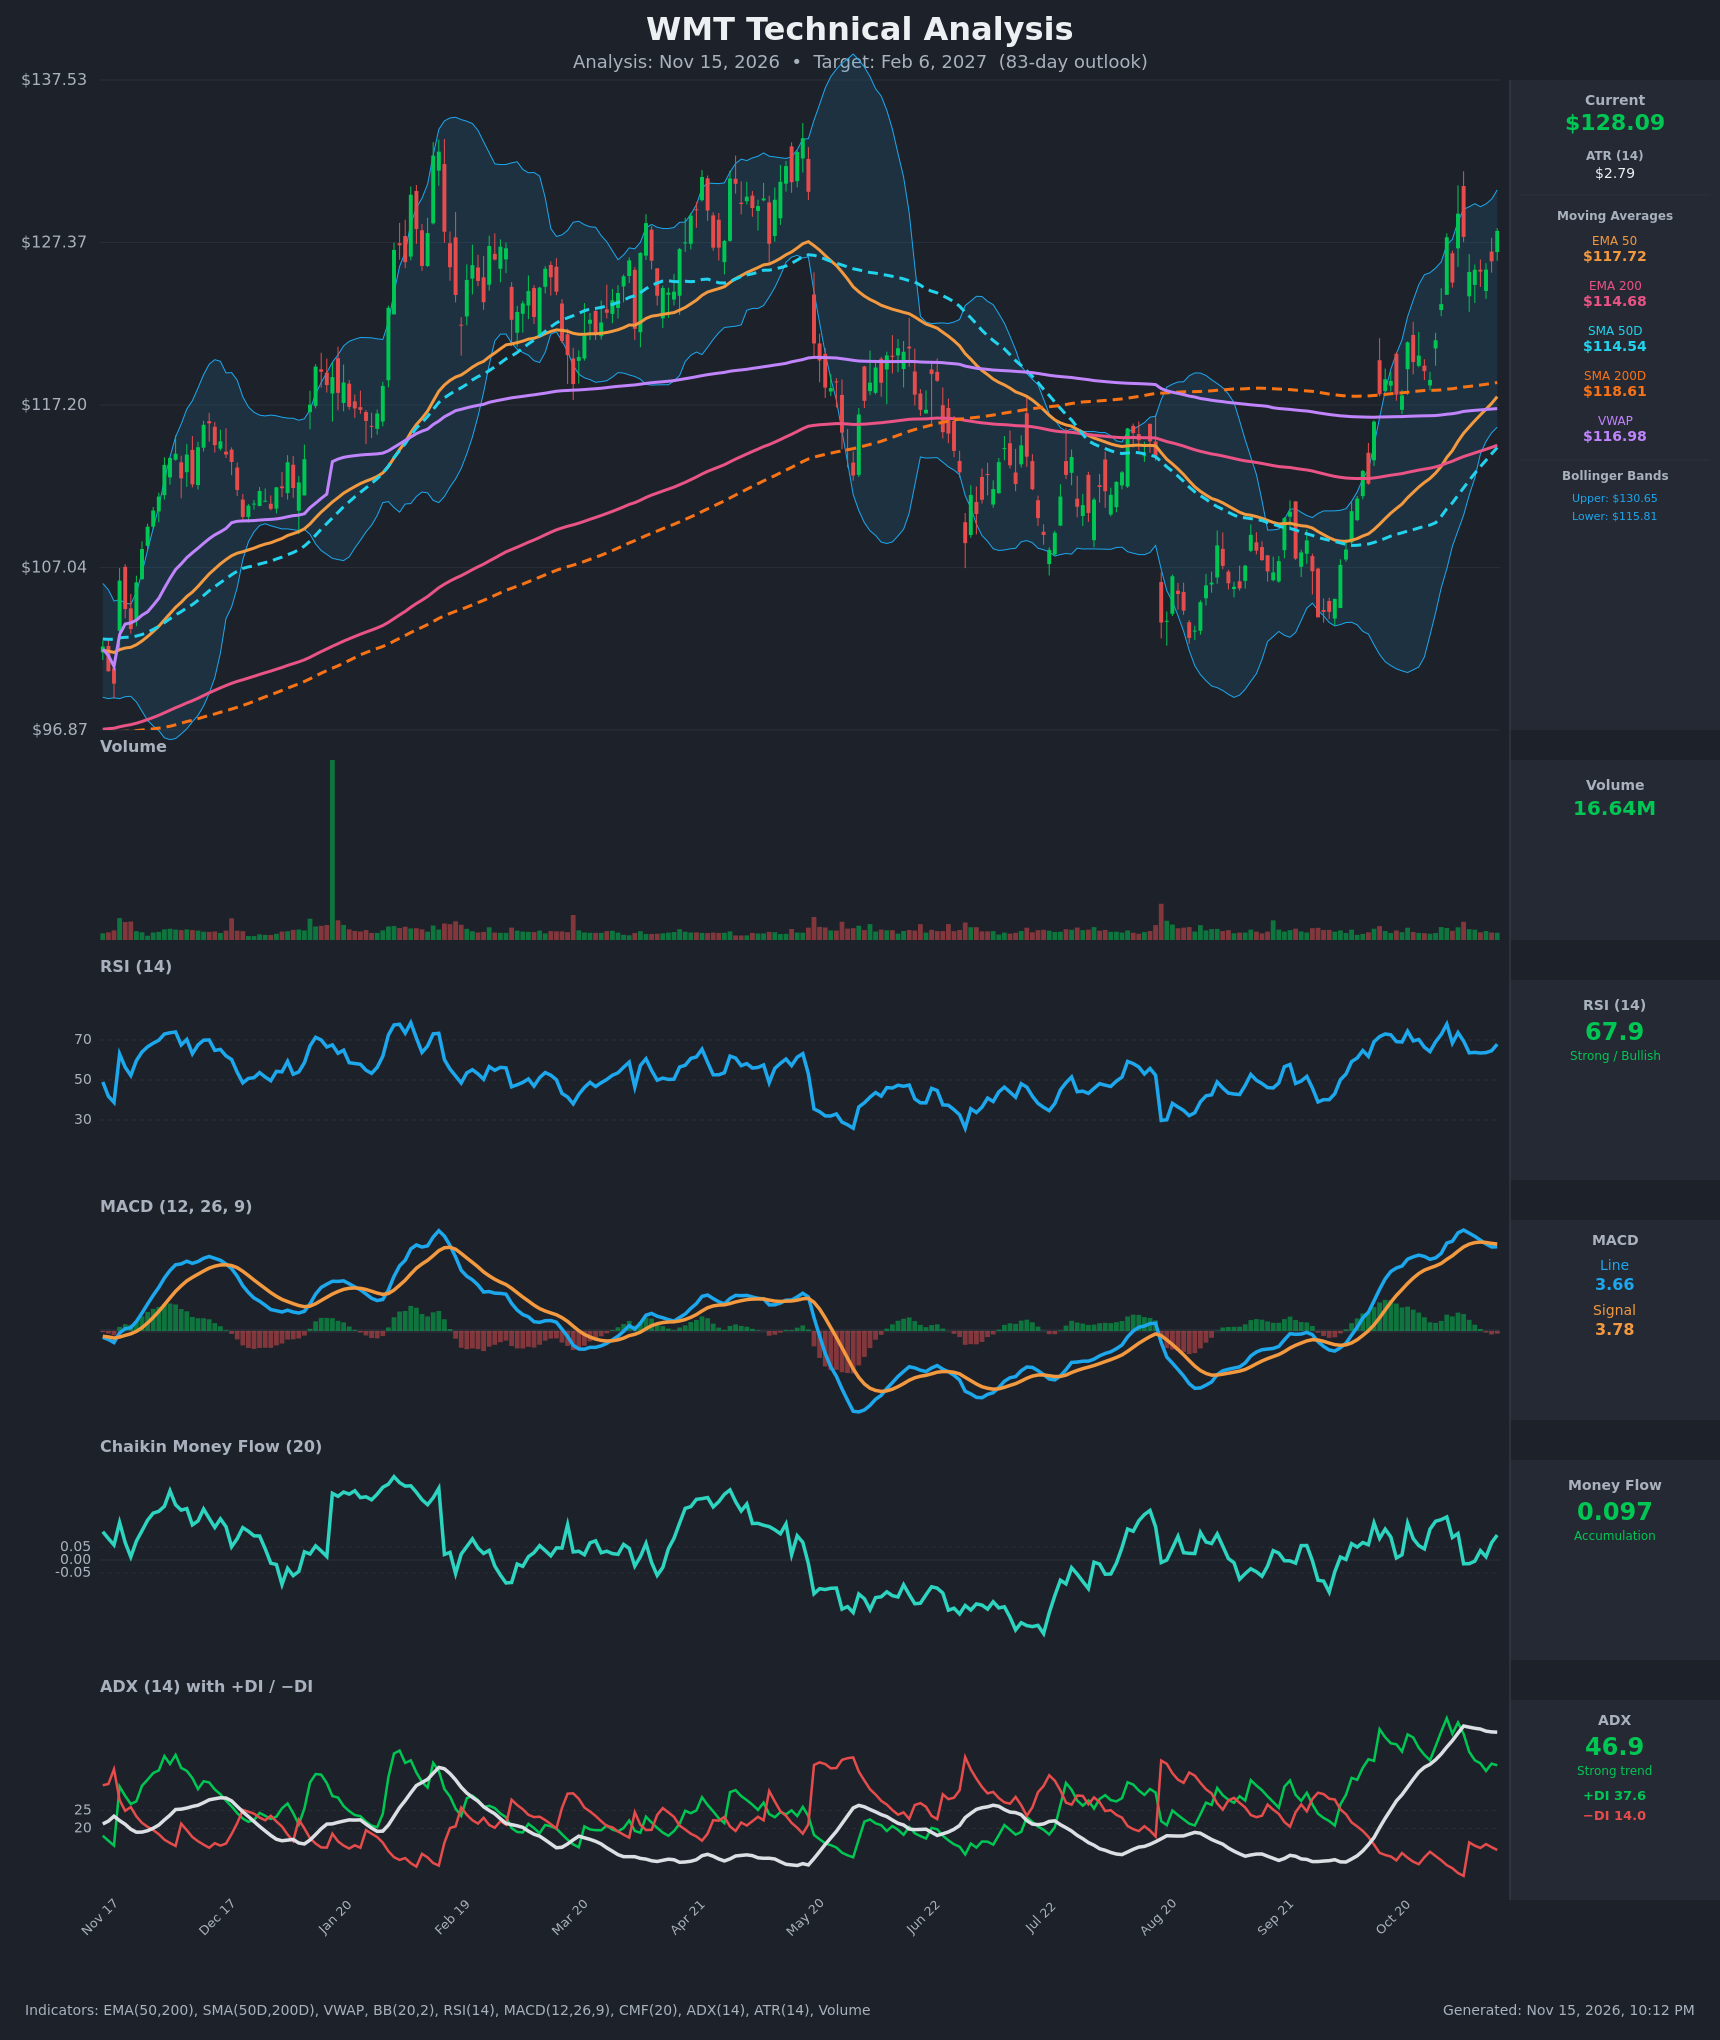
- RSI (14): 67.91, just under the 70 overbought line. It has held in the 63–78 range for about three weeks, so momentum is strong but not extended. It bounced from 63.5 on Nov 10 to 67.9. [Bullish]
- 20 EMA: The 20 EMA isn't supplied, but the 50 EMA is $117.72 and rising, and price at $128.09 sits about 8.8% above it. Price has stayed well above the short-term averages through the whole advance. The stretch from the 50 EMA raises mean-reversion risk, but the trend structure is intact. [Bullish]
- MACD: Line 3.657 vs signal 3.776, so the histogram is slightly negative (about -0.12). The line crossed below the signal around Nov 11–12 after peaking at 4.38 on Nov 5. The line ticked up on Nov 13 (3.650 to 3.657), so the bearish cross is shallow and may be flattening out. Momentum is cooling, not reversing. [Neutral]
- Bollinger Bands (20): Upper $130.65, lower $115.81, midline about $123.2. Price at $128.09 is in the upper quarter of the bands, about $2.56 below the upper band. The bands are wide after the breakout, and price has been riding the upper half. [Bullish]
- CMF (20): 0.097, above +0.05, after dipping slightly negative on Nov 5–9 (about -0.015). It has recovered, which points to renewed accumulation on the push back toward highs. [Accumulation]
- ADX (14): 46.9, a very strong trend, with +DI 37.6 far above −DI 14.0. ADX has plateaued after peaking near 48.6, which often marks a mature trend. Readings this high can precede consolidation, though bulls remain firmly in control. [Strong Trend + Bullish]
- Volume: 16.64M, in line with recent averages and with no spike on the latest advance. The big breakout leg has not had standout participation, so conviction is moderate. [Neutral-to-Mildly Bullish]
DIVERGENCES & TRENDS
- Mild bearish momentum divergence: Price on Nov 13 ($128.09) is near the Nov 4 high ($129.17), but RSI is 67.9 vs 73.7 and MACD is 3.66 vs 4.26. Momentum is lower on the retest, a small warning of a pause.
- MA structure: EMA50 ($117.72) has crossed above EMA200 ($114.68) and the gap is widening, which is bullish. SMA50D ($114.54) is still below SMA200D ($118.61), so there is no golden cross yet, though the gap is closing quickly (about $4.07, down from about $8.6 on Oct 26). A golden cross is plausible within the 83-day window if price holds.
- Price vs long-term averages: Price is above SMA200D, EMA200 and VWAP ($116.98), confirming a long-term uptrend after the Aug–Sep low near $100.
- DI: +DI has dominated −DI since early October. The −DI bump to 16 on Nov 6 was brief.
- Bearish MACD cross: It is shallow and happened at an elevated level, which usually means consolidation rather than trend failure.
- Volatility: The October breakout came from a low-volatility base, with bands expanding sharply. This is a classic volatility-expansion trend leg.
CHART PATTERNS
- Bullish base into breakout: The decline from the April–May peak (about $133) to the $100 low, then the sharp recovery, looks like a rounded or double-bottom-style base (Aug and Sep lows near $100). The breakout above the $118 SMA200D and the prior range confirms it. The measured move from a base around $100–$118 would point to the $135–$137 area.
- Bullish flag (mild): Since Nov 4 (high $129.17), price has consolidated between about $124.9 and $129.2 in a slightly descending channel. This resembles a bullish flag or pennant after the Oct 28–Nov 4 impulse. A break above $129.2 targets about $135–$137.
- Resistance zone: The prior highs near $133–$137 (April–May) cap upside and are the natural target and supply area.
- Risk: Price is extended about 8–9% above the 50 EMA, so a pullback toward the $118–$123 zone (midline, VWAP and EMA50) is possible before continuation.
POTENTIAL SCENARIOS
- Scenario 1: Bullish Flag Breakout and Trend Continuation — Price holds the $124–$125 consolidation floor, then breaks above $129.2 as ADX stays above 40 and CMF stays positive. A golden cross forms in the SMA50D/SMA200D pair during the window. Trigger: daily close above $129.20 on higher volume. Target: $134–$137 (prior highs). Invalidation: close below $123.5. (50% probability)
- Scenario 2: Neutral Consolidation and Range Digestion — The overextended move cools. Price chops between roughly $120 and $131 as MACD resets and RSI falls toward 50, with the 50 EMA and VWAP catching up. Trigger: repeated failure at $129–$131 with fading ADX. Target: $123–$128. Invalidation: a break above $131 or below $118. (30% probability)
- Scenario 3: Bearish Mean-Reversion Pullback — Momentum divergence plays out, and price loses the flag support and the BB midline, retracing toward the rising 50 EMA and SMA200D. Trigger: close below $123.5 with MACD below zero-line momentum fading. Target: $116–$119. Invalidation: reclaim of $128. (20% probability)
PRICE TARGETS
- Target Price: $131.50 (83-day horizon; trend-continuation bias with some drag from extension, since the 83-day move is expected to stall below the $133–$137 supply zone)
- Expected Range: $116.00 to $142.00 (width $26.00, about 20.3% of the current price, consistent with the 61–180 day guidance of 18–30%)
- Key Levels: Support at $123.50, Resistance at $133.00
OVERALL BIAS
OVERALL BIAS: BULLISH - ADX at 46.9 with +DI far above −DI, price above all major averages after a base breakout, EMA50 above EMA200 and CMF in accumulation favor continuation toward the $131–$137 area. The shallow MACD cross and RSI divergence argue for a pause or pullback first, but they don't yet break the trend.
This is educational analysis and not financial advice.