QCOM 4-day bearish forecast — Oct 31, 2026
- Bias: Bearish
- Timeframe: 4 days (made Oct 31, 2026, target date Nov 3, 2026)
- Price at analysis: $164.97
- Price target: $163.20
- Expected range: $159.80 – $168.60
- Result: Correct (-0.3%) — closed at $164.43 on Nov 3, 2026; quality score 100/100
Get a free AI analysis of QCOM today
Analysis
TECHNICAL INDICATORS
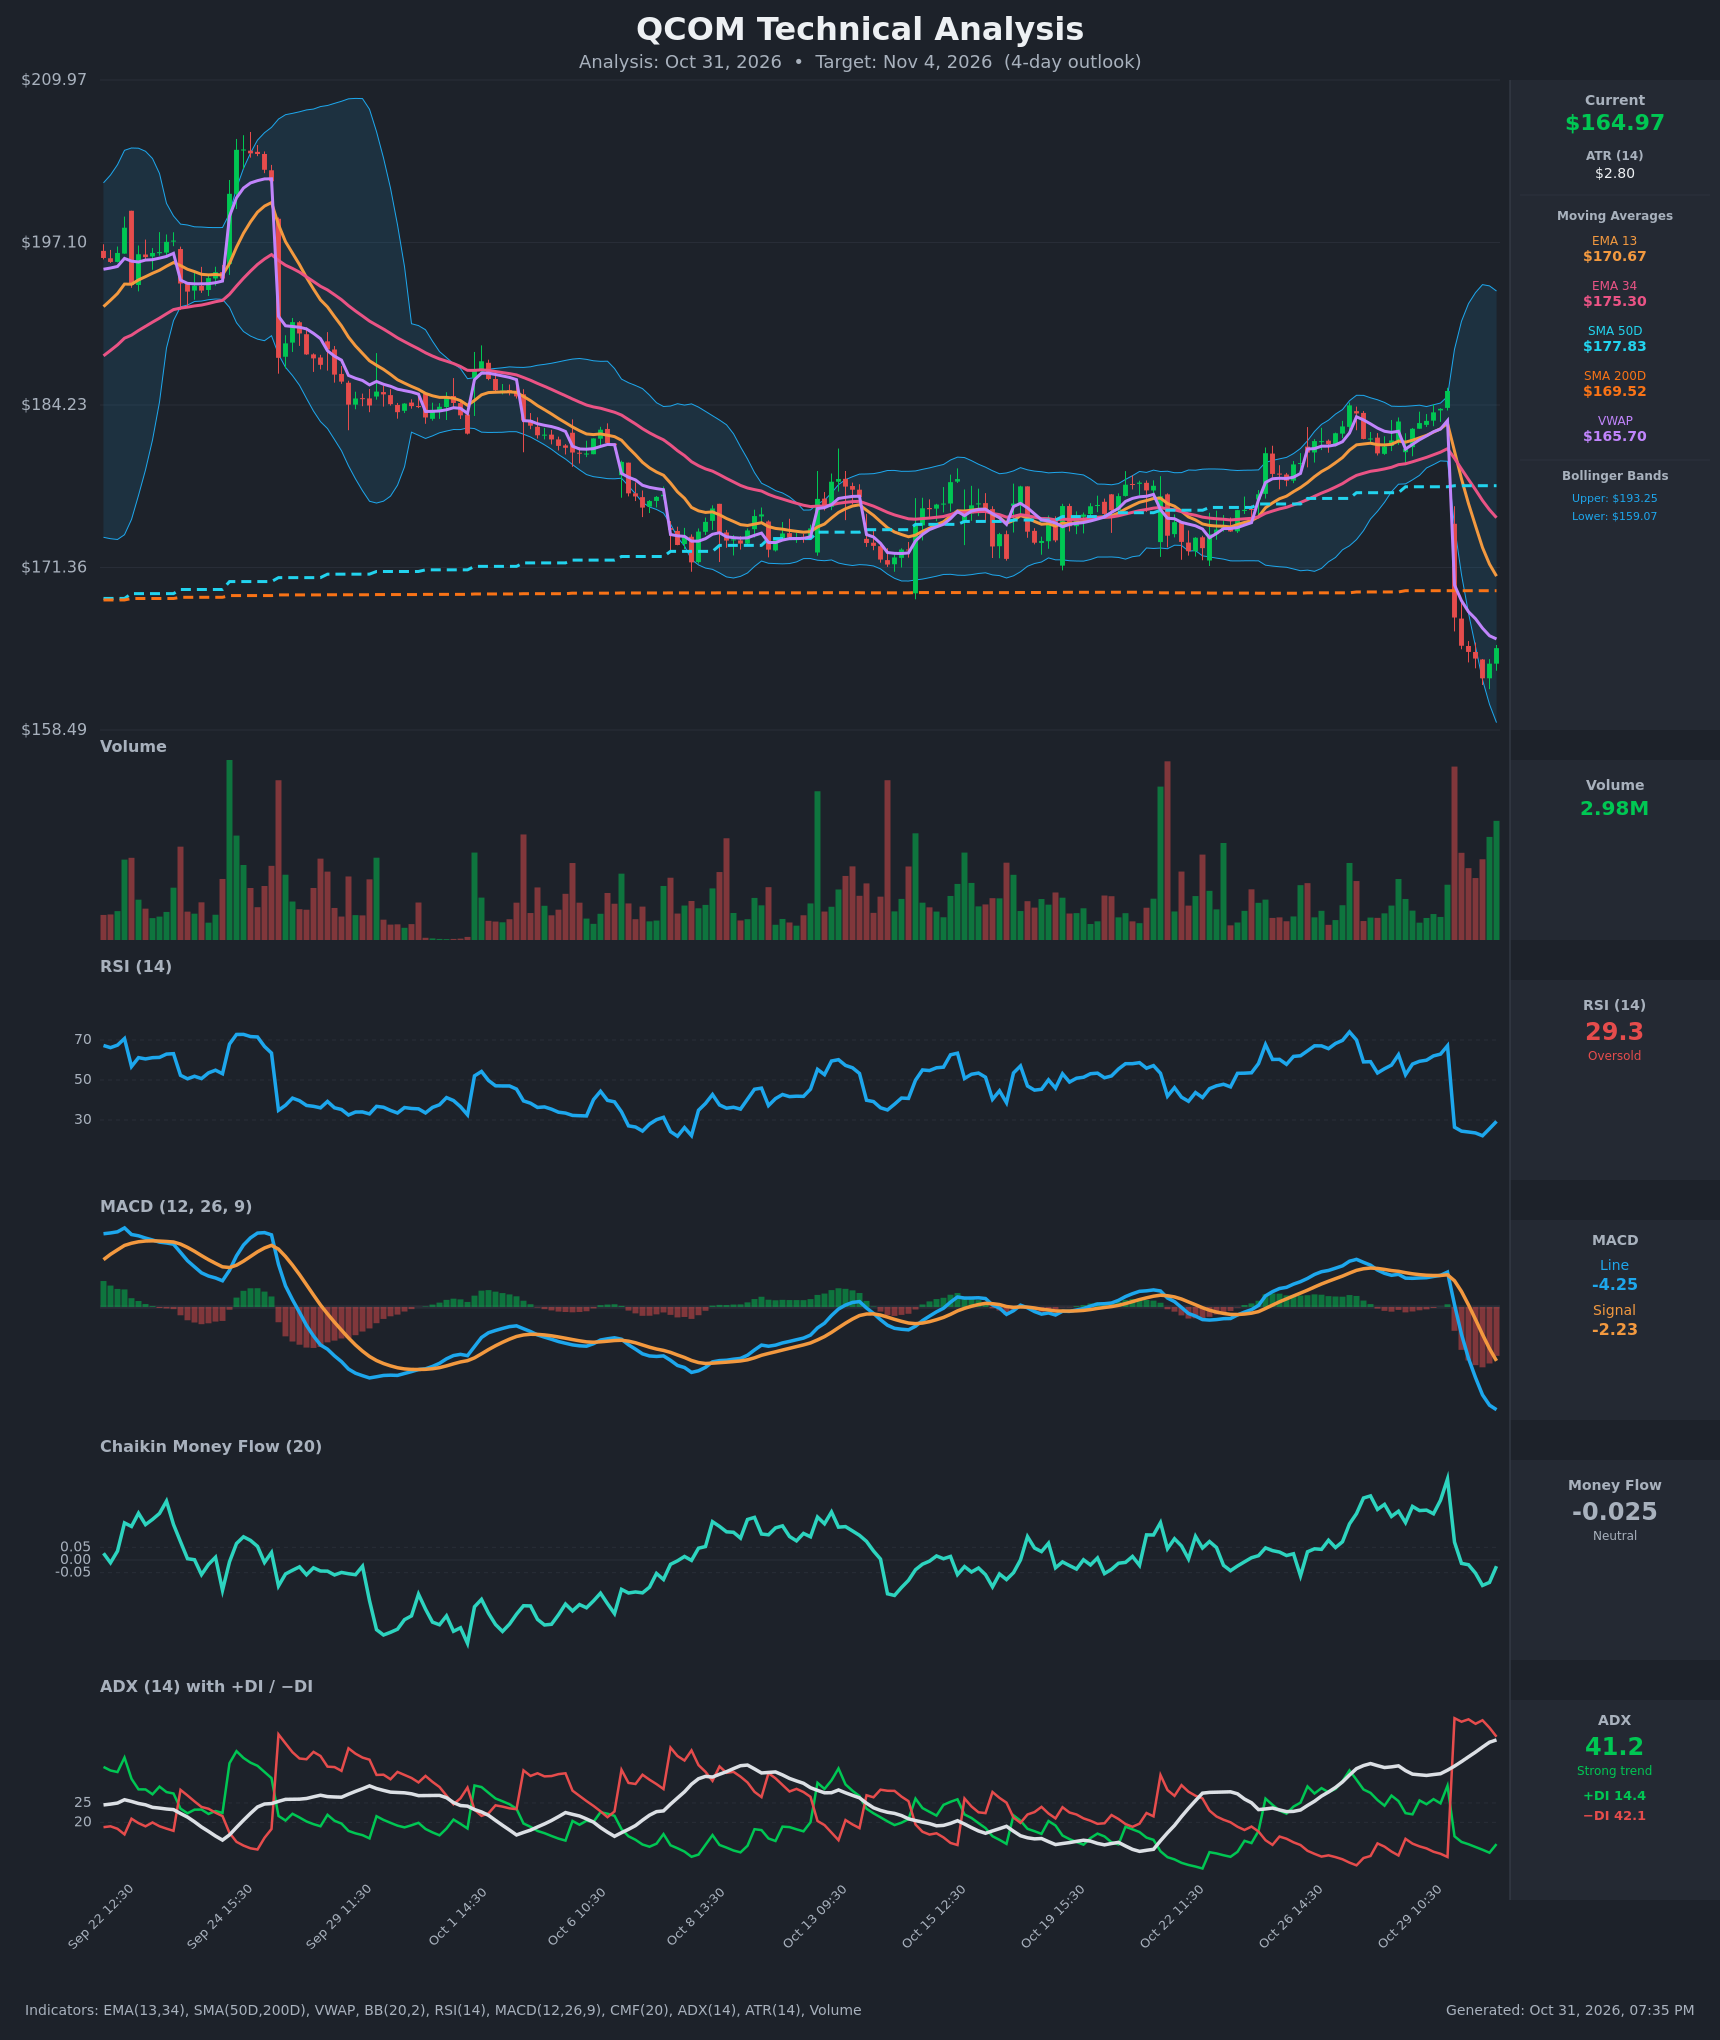
- RSI (14): 29.32, in oversold territory. It collapsed from 67 to 22 on the Oct 30 gap and has ticked up to 29 from the 22.1 low. This is an early bounce attempt, not a confirmed reversal. [Bearish]
- 20 EMA: The chart shows EMA 13 at $170.67 and EMA 34 at $175.30. Price at $164.97 is below both, and both are sloping steeply down. EMA 13 crossed below EMA 34 on Oct 30 10:30, so overhead EMAs act as resistance. [Bearish]
- MACD: Line -4.25 is below signal -2.23, and the bearish crossover happened on Oct 30 12:30. The histogram is deeply negative and still widening, so downside momentum is not yet exhausted. [Bearish]
- Bollinger Bands (20): Upper $193.25, lower $159.07. The bands are extremely wide after the gap, and price sits in the lower quarter, about $5.90 above the lower band. This shows stretched downside but no band-walk exhaustion signal yet. [Neutral]
- CMF (20): -0.025, between ±0.05, so neutral. It has fallen from +0.32 before the gap and sits slightly negative. The latest uptick (-0.101 to -0.025) hints at light dip buying. [Neutral]
- ADX (14): 41.2 and rising, with −DI 42.1 far above +DI 14.4. This is a strong, established downtrend with bears firmly in control. [Strong Trend – Bearish]
- Volume: 2.98M on the latest bar. Volume was heavy on the gap-down bars, and the last two bars show rising green volume, which suggests early bargain hunting. There is no capitulation spike yet. [Mildly Bullish / Unconfirmed]
Other context from the data:
- Price is below VWAP ($165.70), which is marginally bearish.
- Price is below SMA200 ($169.52) after losing it on the gap. It is also below SMA50 ($177.83). The SMA50 is above the SMA200, so there is no death cross, but the break of the SMA200 is a significant technical damage.
DIVERGENCES & TRENDS
- There is no bullish RSI or MACD divergence. Both made new lows together with price, so the momentum confirms the move.
- RSI is turning up from 22 while price makes a marginally higher low, which is a minor short-term momentum improvement only.
- The EMA 13/34 bearish crossover is complete, and the MACD bearish crossover is complete. The −DI/+DI flip (−DI 42 vs +DI 14) is decisive.
- The SMA200 ($169.52) was broken on the gap and now acts as overhead resistance. The gap from about $185 to $167 remains unfilled.
- The previous consolidation range ($171–$185) now sits above as supply.
CHART PATTERNS
- The ~10% gap-down candle is followed by small-bodied hourly bars drifting sideways to slightly down. This resembles an early Bearish Pennant / Bearish Flag from the reference diagram, but it is only a few bars old and not yet validated.
- A break below the Oct 30 low (~$162.58) would confirm continuation. The measured move of the flagpole is far larger than a 4-day horizon, so I only expect partial progress toward the lower Bollinger Band around $159.
- The earlier multi-week sideways range ($171–$185) was a rectangle/consolidation. The break below it is bearish.
- A Bullish Falling Wedge or Double Bottom is not yet visible. A bounce would need a reclaim of the SMA200.
POTENTIAL SCENARIOS
- Scenario 1: Bearish Post-Gap Continuation — Sellers keep control (ADX 41, −DI dominant, MACD widening). Price fails at VWAP/EMA 13 and grinds lower toward the lower Bollinger Band. Trigger: a break below $162.58 (Oct 30 low) on rising volume. Target: $159.00–$160.00. Invalidation: a close above $169.50 (SMA200). (50% probability)
- Scenario 2: Bullish Oversold Relief Bounce — RSI below 30 and a stretched move allow a mean-reversion bounce, with a partial gap fill toward the declining EMA 13 and SMA200. Trigger: a reclaim of VWAP ($165.70) with expanding green volume. Target: $169.00–$170.50. Invalidation: a break below $162.50. (35% probability)
- Scenario 3: Neutral Base-Building — Price chops between $162 and $168 as the market digests the gap. Trigger: low-volume overlap of recent bars. Target: $163–$166. Invalidation: a close outside $161.50–$169.00. (15% probability)
PRICE TARGETS
- Target Price: $163.20 (4-day)
- Expected Range: $159.80 to $168.60 (width $8.80, about 5.3% of the current price, which fits a 4-day horizon)
- Key Levels: Support at $159.07 (lower Bollinger Band), Resistance at $169.52 (SMA200). VWAP at $165.70 is minor intermediate resistance.
OVERALL BIAS
OVERALL BIAS: BEARISH - A strong, rising ADX (41.2) with −DI far above +DI, a bearish MACD crossover with a widening negative histogram, and price below all moving averages including the SMA200 favor modest continuation lower. The oversold RSI limits the size of the move and leaves a meaningful chance of a relief bounce.
This is educational analysis and not financial advice.