QCOM 7-day bearish forecast — Oct 31, 2026
- Bias: Bearish
- Timeframe: 7 days (made Oct 31, 2026, target date Nov 6, 2026)
- Price at analysis: $164.97
- Price target: $162.50
- Expected range: $157.50 – $169.00
- Result: Correct (+0.4%) — closed at $165.66 on Nov 6, 2026; quality score 100/100
Get a free AI analysis of QCOM today
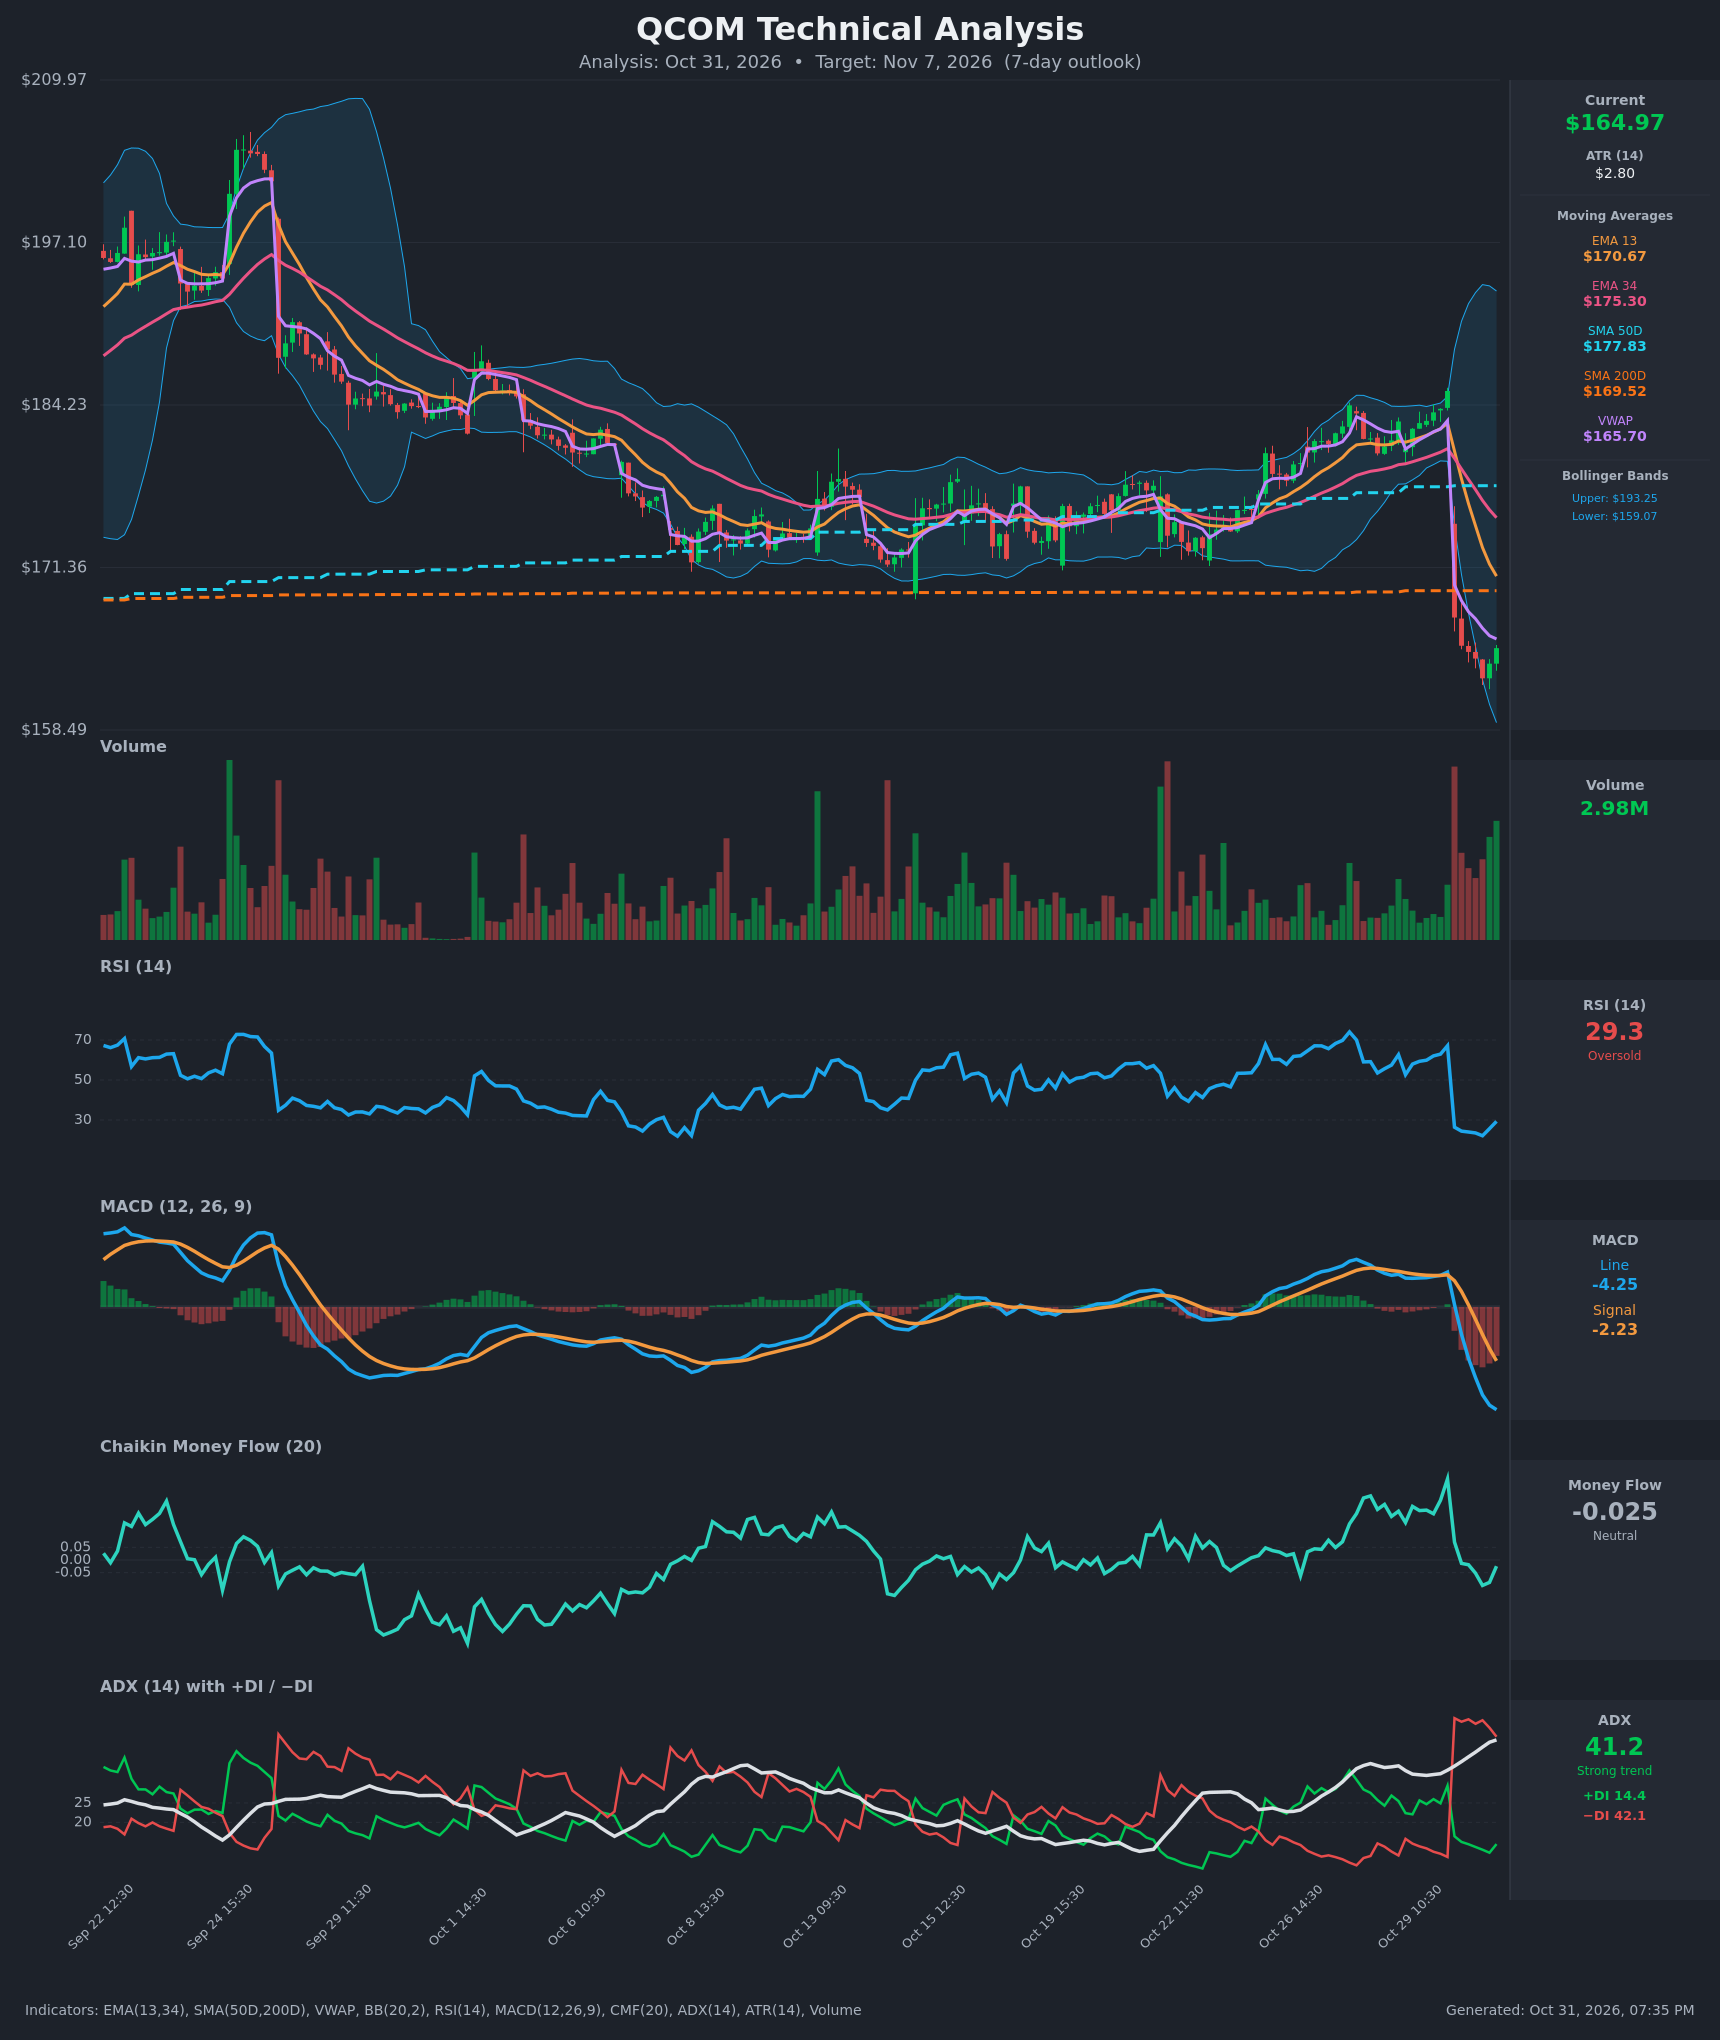
Analysis
TECHNICAL INDICATORS
- RSI (14): 29.32, oversold, after collapsing from 67.1 to 26.4 on the Oct 30 gap and bottoming at 22.1. It has ticked up to 29.3, but it is still below 30 and well below the 50 midline. Oversold readings in a strong downtrend can persist, so this signals a possible relief bounce rather than a reversal. [Neutral]
- 20 EMA: The data gives EMA 13 at $170.67 and EMA 34 at $175.30. Price at $164.97 is below both, and EMA 13 crossed below EMA 34 on Oct 30 (10:30). Both averages are sloping down and now act as overhead resistance. [Bearish]
- MACD: Line -4.245 is below Signal -2.226, a fresh bearish crossover on Oct 30 that has widened quickly. The histogram is deeply negative at about -2.0, and the line is still falling, so downside momentum has not yet exhausted. [Bearish]
- Bollinger Bands (20): Upper $193.25, lower $159.07. The bands were widened by the gap, and price sits in the lower quarter, about $5.90 above the lower band. The break below the prior range is a volatility expansion to the downside. A bounce toward the midline (~$176) is possible, but price is not yet pinned to the lower band. [Bearish]
- CMF (20): -0.025, between ±0.05, so neutral. It fell from +0.32 to slightly negative and has ticked up in the last bar. That is a sharp deterioration from accumulation, but it has not yet confirmed heavy distribution. [Neutral]
- ADX (14): 41.2 and rising from 32, so the trend is strong. −DI at 42.1 is far above +DI at 14.4. The gap-down move is a high-strength bearish trend. [Strong Trend – Bearish]
- Volume: The latest bar is 2.98M and green, the first sizable up-volume bar after a cluster of heavy red volume on the gap. That hints at early dip-buying, but it is not enough to confirm a reversal. Price is also below VWAP ($165.70), which marks short-term selling pressure. [Mildly Bearish / early stabilization]
DIVERGENCES & TRENDS
- No bullish RSI/price divergence yet. RSI made a lower low (22.1) with price, so momentum confirms the move.
- Price lost every key average in one session: EMA 13, EMA 34, SMA 50D ($177.83) and SMA 200D ($169.52). The SMA 200D loss is the first since before the September range.
- The MACD bearish crossover and the −DI/+DI flip both happened on the gap bar. Trend indicators agree with each other.
- A death cross is not in place, since SMA 50D is still above SMA 200D, but the 50D is flattening and price is already below both.
- Price is below VWAP, and the VWAP is rolling over.
- The gap from ~$185 to ~$167 is unfilled. The first overhead fill zones are SMA 200D at $169.52 and EMA 13 at $170.67.
- CMF is trending down from strongly positive and has crossed into slightly negative territory.
- The Oct 29 high (~$185) was a lower high versus the Sept 24 peak (~$205), so the longer structure is a series of lower highs.
CHART PATTERNS
- Failed breakout / bull trap: The Oct 22–29 push out of the $175–180 range reversed fully in a single gap. This resembles a Bearish Double Top structure at the macro level, with lower highs at ~$205 and ~$185 and a breakdown through support.
- Possible Bearish Flag/Pennant: If price drifts sideways or up in a tight, declining channel over the coming days beneath $169–171, that would be a continuation pattern. Its measured move would target roughly $155–$158, based on the ~$18 pole from $185 to $167.
- Gap fill: The unfilled gap suggests a relief bounce is possible, but the SMA 200D and EMA 13 near $169.5–$170.7 should cap it.
- No bullish reversal pattern, such as a double bottom or falling wedge, is confirmed yet.
POTENTIAL SCENARIOS
- Scenario 1: Bearish Post-Gap Drift Lower — Sellers stay in control after the gap, with ADX above 40 and −DI dominant. Any bounce stalls under the SMA 200D and EMA 13, then price rolls over and grinds toward the lower Bollinger Band. Trigger: rejection at $169–$171, or a break below the Oct 30 low of $162.58. Target: $159–$160, with an extension to ~$157. Invalidation: daily close above $171 (EMA 13) with rising volume. (45% probability)
- Scenario 2: Bullish Oversold Relief Bounce — RSI near 29 and the first green volume bar produce a mean-reversion move that partially fills the gap. Trigger: reclaim of VWAP ($165.70) and a push through $169.52 (SMA 200D). Target: $170.50–$172, near EMA 13, with a stretch to $175 (EMA 34). Invalidation: failure at $170 followed by a break below $162.50. (35% probability)
- Scenario 3: Neutral Base Building — Price consolidates between the gap low and the SMA 200D as selling pressure fades and CMF stays near zero. Trigger: low-volume chop between $162 and $169. Target: $164–$167. Invalidation: close outside $161–$170. (20% probability)
PRICE TARGETS
- Target Price: $162.50 (7-day, about -1.5% from $164.97)
- Expected Range: $157.50 to $169.00 (width $11.50, about 7.0% of price, in line with the 4-8% guidance for 7-10 days; consistent with ~1.5× the 7-day ATR move)
- Key Levels: Support at $159.07 (lower Bollinger Band), then $157.50. Resistance at $169.52 (SMA 200D), then $170.67 (EMA 13).
OVERALL BIAS
OVERALL BIAS: BEARISH - Price gapped below the EMAs, SMA 50D and SMA 200D. MACD has crossed bearishly, and ADX is 41 with −DI far above +DI. The oversold RSI and the first green volume bar suggest a bounce, but I expect it to be capped near $169.5–$170.7 before the trend resumes lower.
This is educational analysis and not financial advice.