BB 7-day bearish forecast — Oct 31, 2026
- Bias: Bearish
- Timeframe: 7 days (made Oct 31, 2026, target date Nov 6, 2026)
- Price at analysis: $8.41
- Price target: $8.20
- Expected range: $7.95 – $8.65
- Result: Incorrect (+3.7%) — closed at $8.72 on Nov 6, 2026; quality score 22/100
Get a free AI analysis of BB today
Analysis
TECHNICAL INDICATORS
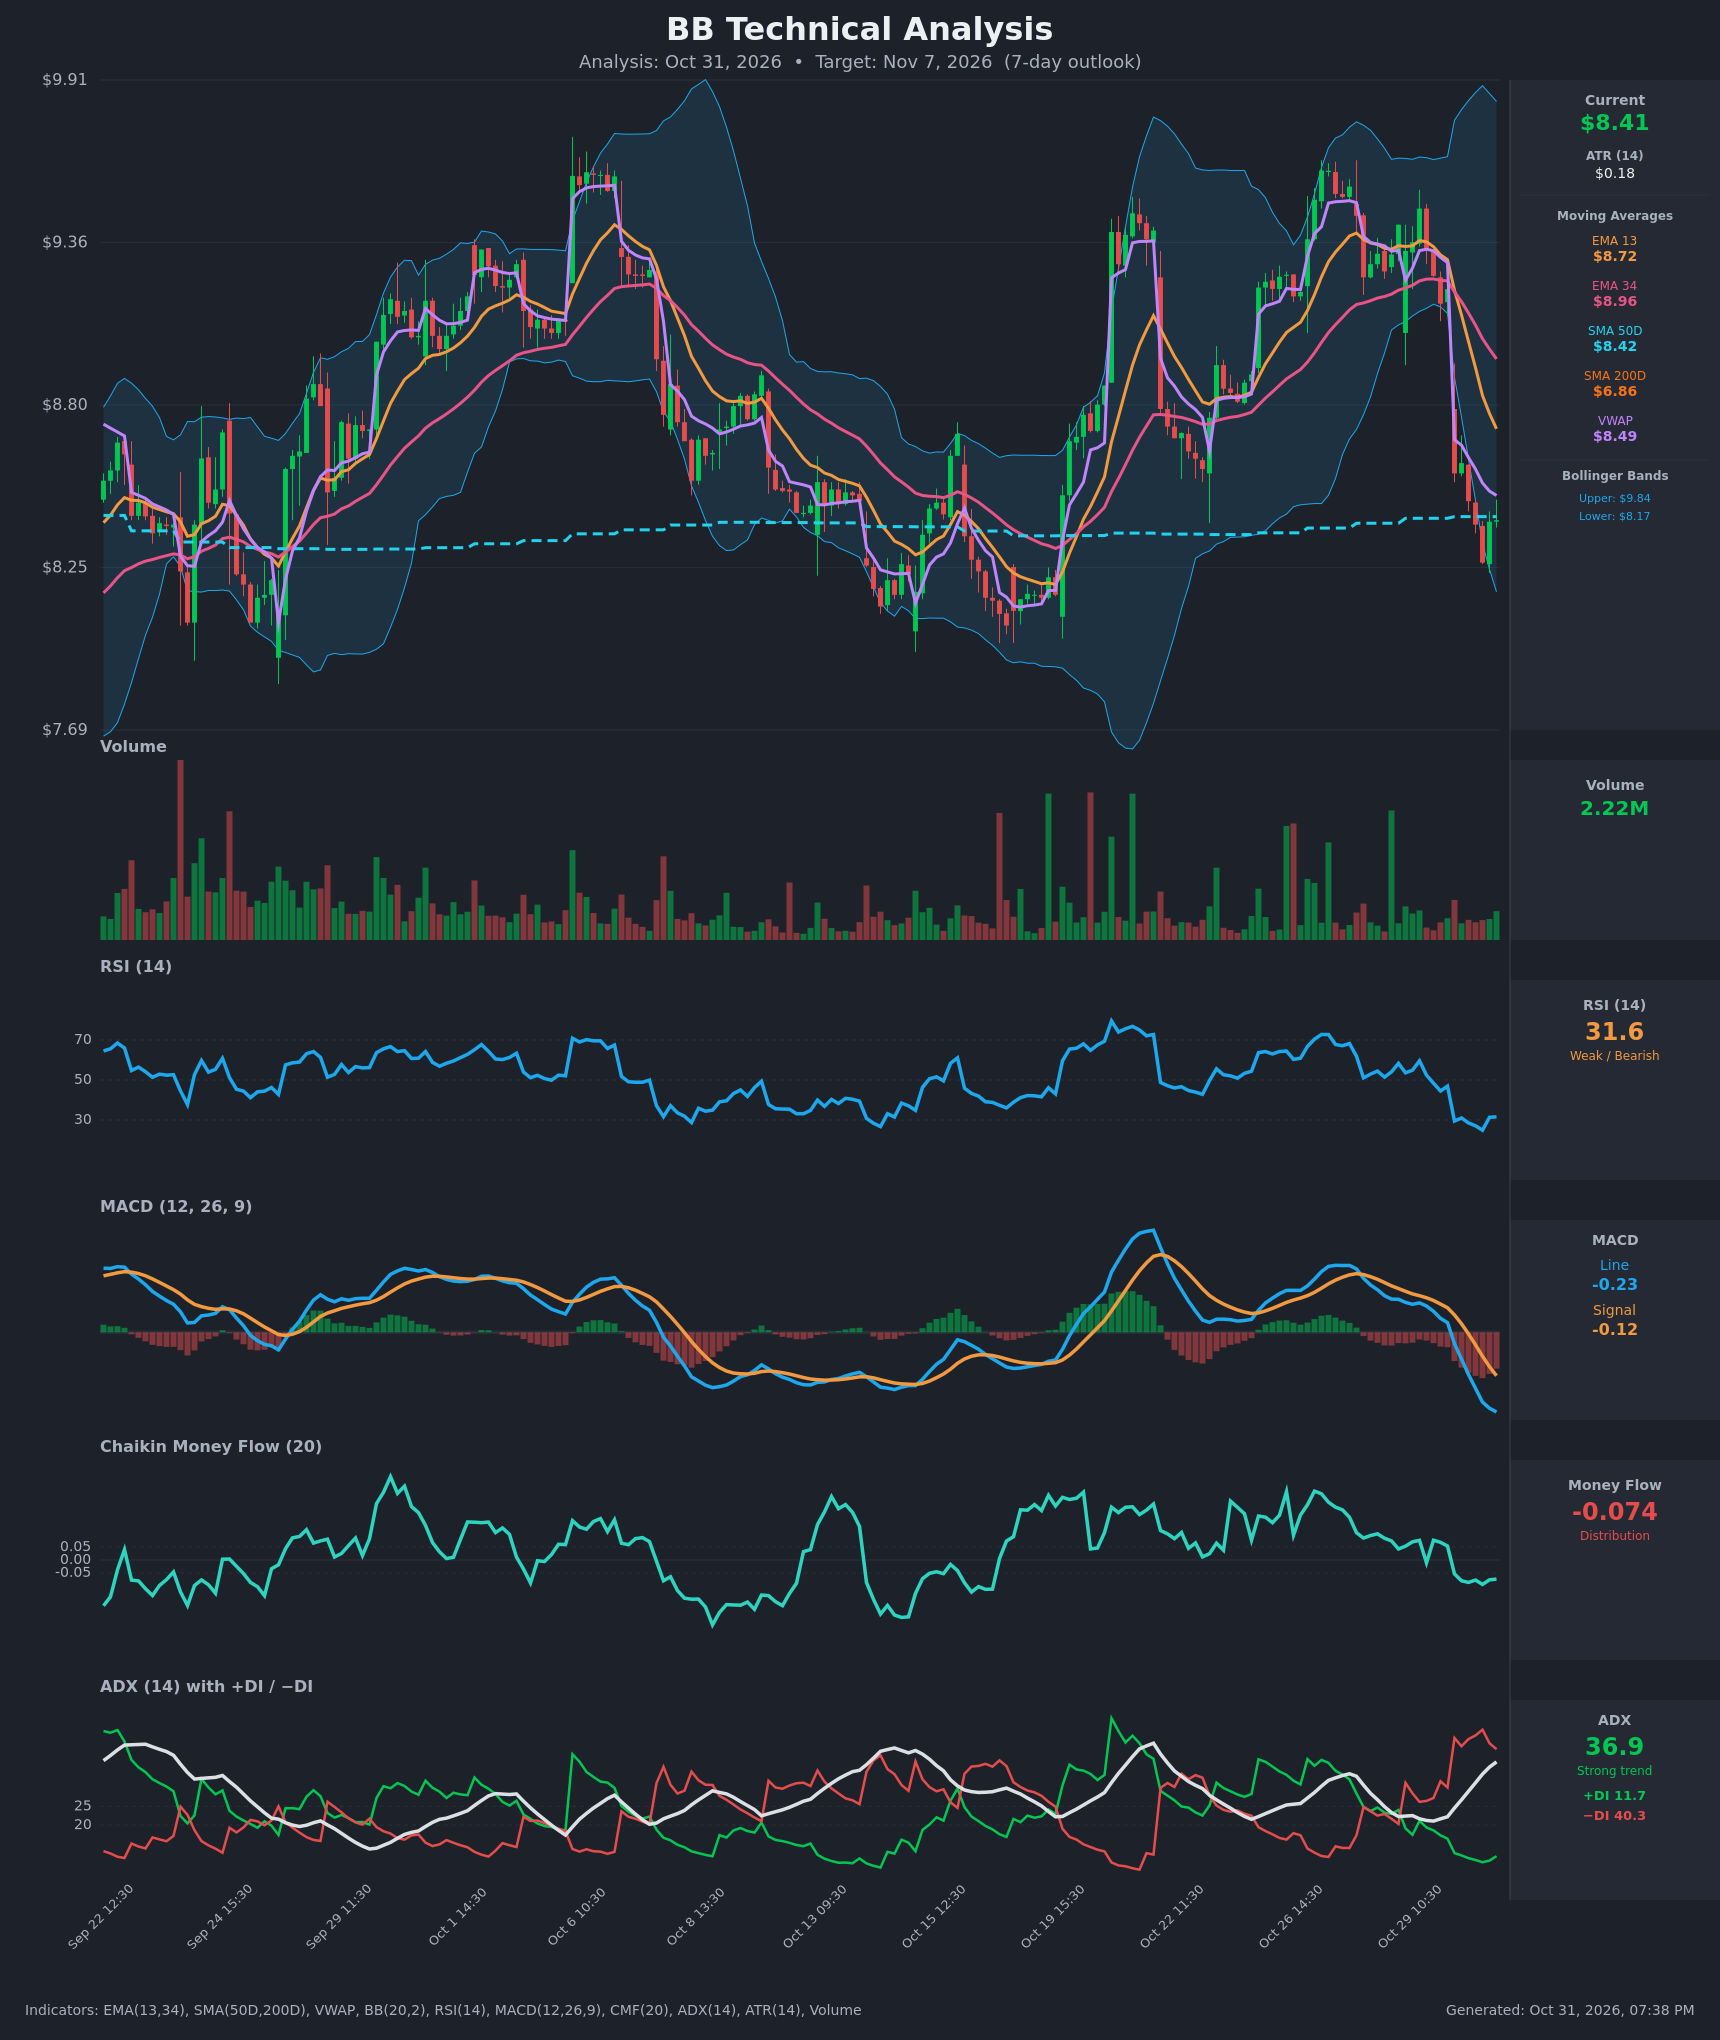
- RSI (14): 31.58, just off the 24.9 intraday low and near oversold. It fell from about 59 on Oct 29 to the high 20s on Oct 30, and the bounce to 31 is weak. Oversold readings in a strong downtrend can persist, though a short-term bounce is possible. [Bearish]
- 20 EMA: The data gives EMA 13 at $8.72 and EMA 34 at $8.96, and price at $8.41 is below both. EMA 13 is falling fast and sits above price as resistance. EMA 13 crossed below EMA 34 on Oct 30 at about $9.0, a fresh bearish crossover. [Bearish]
- MACD: The line is -0.227 and the signal is -0.124, so the line is below the signal. The bearish cross happened on Oct 30 and the histogram is widening negative. The line is at its lowest in about a month. There is no sign of momentum turning yet. [Bearish]
- Bollinger Bands (20): Price is $8.41 against a lower band of $8.17 and an upper band of $9.84. The bands are wide, and price sits in the lower quarter after the gap-down. A band-walk toward $8.17 is possible, though a reversion bounce toward the midline (about $9.0) can't be ruled out. [Bearish]
- CMF (20): -0.074, below the -0.05 threshold. It turned from positive to negative on the Oct 30 sell-off, which indicates distribution. [Distribution]
- ADX (14): 36.9 and rising, with −DI at 40.3 far above +DI at 11.7. This is a strong downtrend with bears firmly in control. [Strong Trend – Bearish]
- Volume: 2.22M, modest and not a capitulation spike. The Oct 30 gap-down came with decent selling, but there is no exhaustion volume to mark a washout low. Price is $8.41 against VWAP $8.49, so sellers have the intraday edge. [Mildly Bearish]
DIVERGENCES & TRENDS
- There is no bullish RSI or MACD divergence. Both are making new local lows with price, so momentum confirms the decline.
- Price made a sharp one-day drop from about $9.2 to $8.57 on Oct 30, a 6.8% gap that is a notable break of the rising structure.
- The SMA 50D ($8.42) is right at price and has acted as a magnet. SMA 200D ($6.86) is far below, so the long-term trend is still up and no death cross has occurred. The SMA 50D is flat, and a clean break below it would be a negative signal.
- ADX is rising with −DI dominant, so the trend is accelerating rather than fading.
- The month-long range of roughly $8.0–$9.5 means the lower boundary near $8.0–$8.2 is the key support zone, and price is approaching it.
CHART PATTERNS
- The highs near $9.4–$9.6 on Oct 6, around Oct 20 and on Oct 28 loosely resemble a Bearish Triple Top. The sloppy structure makes the match low-confidence. The neckline sits at the $8.0–$8.2 swing lows (mid-Oct low and the lower Bollinger band area). A decisive close below $8.15 would project a measured move toward $7.2–$7.7, but that is beyond a 7-day horizon.
- The sharp gap down is a bearish impulse. A weak bounce under $8.72 (EMA 13) would form a bear-flag-like consolidation, a continuation of the decline.
- If $8.0–$8.17 holds, the range-bound alternative applies (Double Bottom-like with prior lows near $8.0), with a bounce to $8.7–$9.0.
POTENTIAL SCENARIOS
- Scenario 1: Bearish Trend Continuation — Strong ADX, −DI dominance, a bearish MACD cross and negative CMF favor more downside as price loses the SMA 50D and heads for the lower band and the $8.0–$8.17 support zone. Trigger: close below $8.35 and the SMA 50D ($8.42) fails as support. Target: $8.17, then $8.00. Invalidation: close above $8.72 (EMA 13). (50% probability)
- Scenario 2: Bullish Oversold Bounce — RSI near 30 with price at the SMA 50D and near the lower band could trigger a mean-reversion bounce toward VWAP and EMA 13, as happened at prior range lows. Trigger: reclaim of $8.50 (VWAP) on rising volume. Target: $8.72–$8.90. Invalidation: close below $8.17. (35% probability)
- Scenario 3: Neutral Choppy Base — Price digests the drop between $8.17 and $8.55 with ADX peaking. Trigger: low-volume overlapping candles above the lower band. Target: $8.30–$8.50. Invalidation: break outside $8.10–$8.60. (15% probability)
PRICE TARGETS
- Target Price: $8.20 (7-day)
- Expected Range: $7.95 to $8.65 (width $0.70, about 8.3% of current price; slightly above the 4–8% guide to allow for the ATR and the strong trend)
- Key Levels: Support at $8.17 (lower Bollinger Band; $8.00 below it), Resistance at $8.49 (VWAP; $8.72 EMA 13 above it)
OVERALL BIAS
OVERALL BIAS: BEARISH - A strong downtrend (ADX 36.9, −DI 40.3 vs +DI 11.7), a fresh bearish MACD cross, price below EMA 13 and EMA 34, and distribution on CMF outweigh the near-oversold RSI. Risk of a bounce exists near the $8.0–$8.17 support zone.
This is educational analysis and not financial advice.