BB 48-day bullish forecast — Nov 15, 2026
- Bias: Bullish
- Timeframe: 48 days (made Nov 15, 2026, target date Jan 1, 2027)
- Price at analysis: $8.90
- Price target: $9.30
- Expected range: $8.25 – $9.80
- Result: Pending — graded after the close on Jan 1, 2027
Get a free AI analysis of BB today
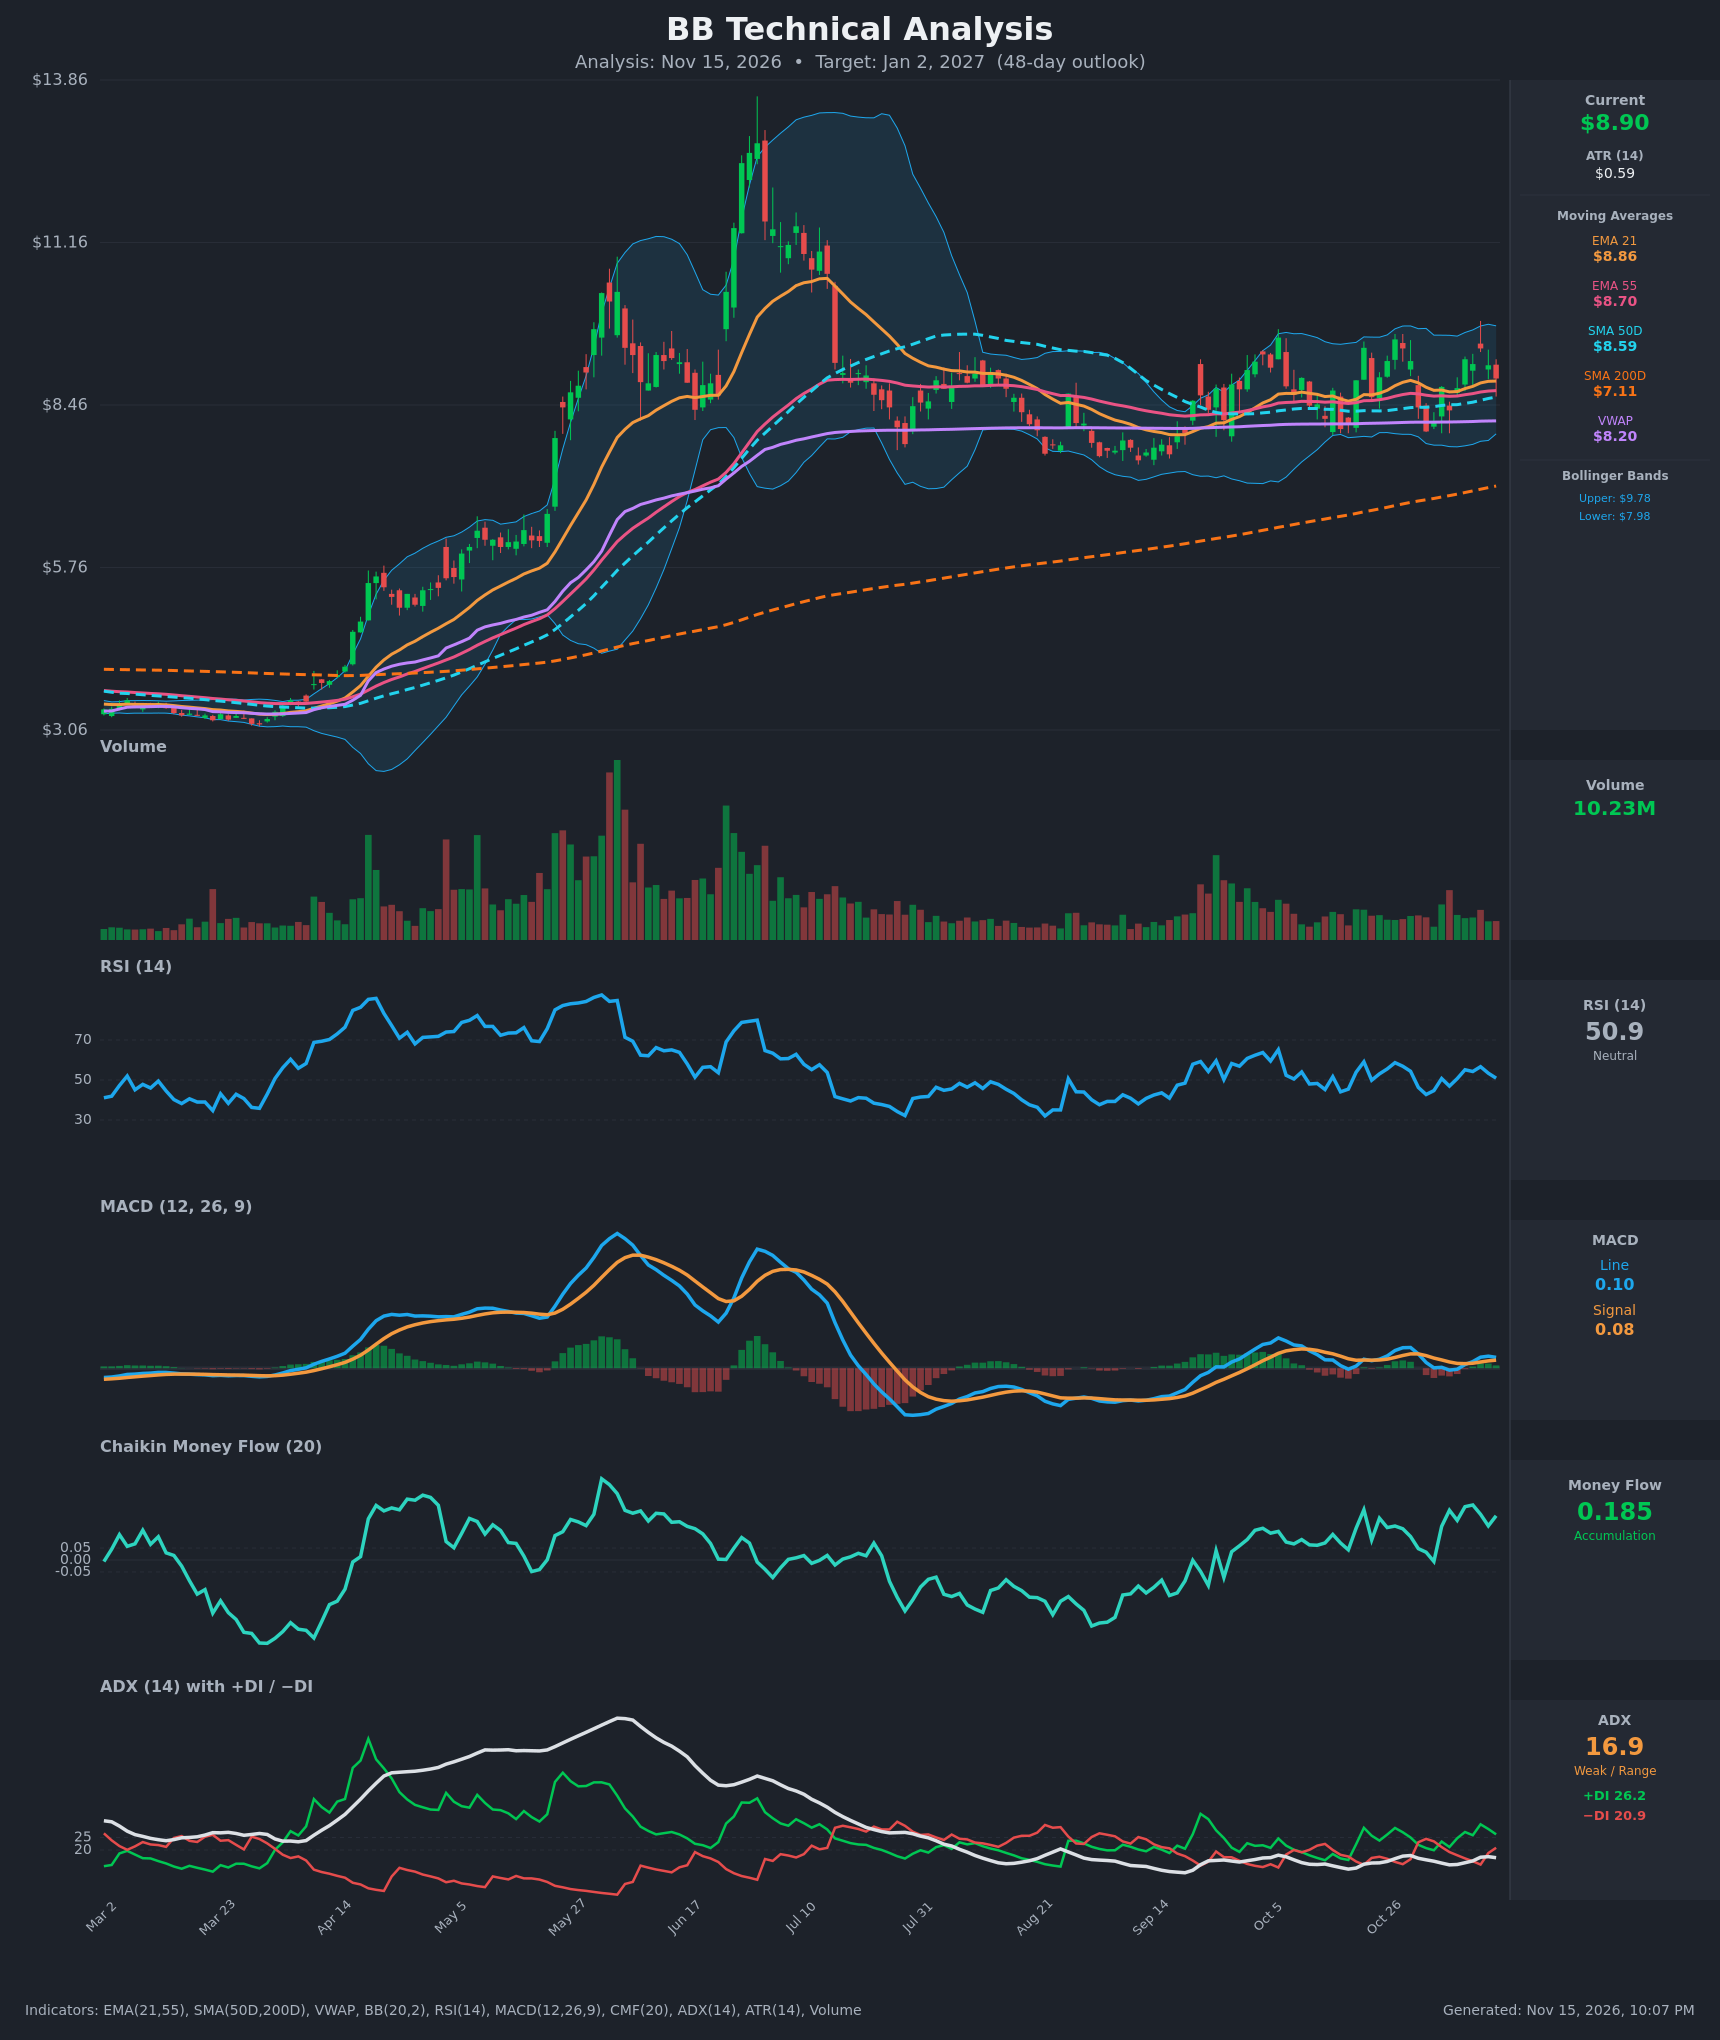
Analysis
TECHNICAL INDICATORS
- RSI (14): 50.92, dead centre of the range. It has oscillated between about 43 and 59 since October without reaching overbought or oversold, and it is easing from 56.7 on Nov 11. Momentum is neutral. [Neutral]
- 20 EMA (EMA 21): $8.86, with price at $8.90, just above it. The EMA is rising and sits above EMA 55 ($8.70), but price is only barely holding it after rejecting $9.40 and is a few cents from losing it. [Bullish]
- MACD: Line 0.104 is above signal 0.077, so the histogram is slightly positive (+0.027). The line turned back up through the signal around Nov 9–10, but it is flattening (0.116 → 0.104) and still near the zero line. This is weak bullish momentum that could roll over. [Bullish]
- Bollinger Bands (20): Upper $9.78, lower $7.98, with the midline near $8.88. Price is sitting right on the midline, so there is no edge from the bands. The bands are moderately narrow compared with the spring and summer expansion, which points to range-bound volatility. [Neutral]
- CMF (20): 0.185, well above +0.05, and positive for most of the last 15 bars. It has been in the 0.13–0.23 zone for weeks. This is persistent accumulation even though price has gone sideways. [Accumulation]
- ADX (14): 16.9, below 20 and drifting down from 17.3. +DI (26.2) is above −DI (20.9), so bulls lead, but the spread is narrowing and there is no real trend. The trend is weak with a slight bullish lean. [Weak Trend, bullish lean]
- Volume: 10.23M, around average and well below the spring and summer surges. Recent up days have had steady participation, but there is no breakout-level volume yet. [Neutral / mildly supportive]
Moving-average structure is bullish. Price ($8.90) is above EMA 21, EMA 55 ($8.70), SMA 50 ($8.59), VWAP ($8.20) and SMA 200 ($7.11). The SMA 50 is well above the SMA 200 (golden cross long since in place), and the MAs are stacked EMA21 > EMA55 > SMA50 > VWAP > SMA200.
DIVERGENCES & TRENDS
- CMF vs price: CMF has made higher highs (0.185–0.23) while price has been flat in a $8–9.5 band. This is a mild bullish divergence, suggesting accumulation under the surface.
- RSI vs price: RSI was 58.7 at the Oct 27 high ($9.55) and 56.7 at the Nov 11 high ($9.40). Slightly lower momentum on a lower price high shows a mild loss of upside momentum.
- MACD: The bearish crossover on Oct 30 was followed by a bullish re-cross on about Nov 9–10. The histogram is thin and the line is flattening, so the signal is fragile.
- DI/ADX: +DI crossed back above −DI on Nov 4. ADX has not confirmed a trend and has been below 20 for weeks, which is consistent with consolidation.
- Pivots: Lows have been rising ($7.4 in Aug/Sep, $8.0 on Nov 2), while highs near $9.4–9.6 have capped rallies.
- Moving averages: There are no fresh crossovers. EMA 21 remains above EMA 55, and the SMA 200 is still rising.
CHART PATTERNS
- Ascending Triangle / range (continuation): Since July, price has been in a $7.4–$9.6 range. A flat resistance zone around $9.4–$9.6 combined with rising lows from about $7.4 to $8.0 resembles the Ascending Triangle in the reference diagram. A close above about $9.6 on volume would project a measured move toward $10.5–$11.0 (triangle height of roughly $1.5–2.0 added to the breakout).
- Possible rectangle/consolidation: A tight base after the spring spike to $13 and the retracement to $7.4, with ADX below 20. The range could continue until a breakout.
- Bearish risk: Failure at $9.4–$9.6 for the third time, with a move below $8.60, would negate the rising-low structure and open $8.00 and then $7.50.
- No clean reversal pattern (double top or head and shoulders) is evident.
POTENTIAL SCENARIOS
- Scenario 1: Bullish Breakout from Ascending Base — Accumulation (CMF 0.185), the golden-cross structure and the rising-lows triangle lead to a push through the $9.5–$9.8 resistance and the upper Bollinger Band. Trigger: daily close above $9.60 on volume above 12M with MACD expanding above zero. Target: $10.20–$10.80. Invalidation: close back below $8.60 (SMA 50/EMA 55 zone). (40% probability)
- Scenario 2: Neutral Range Persistence — ADX stays below 20 and price oscillates between about $8.20 and $9.50 around the EMAs. Trigger: failed breakout attempts and RSI staying at 40–60. Target: $8.50–$9.30. Invalidation: close above $9.70 or below $8.20. (35% probability)
- Scenario 3: Bearish Failure at Resistance — A third rejection near $9.5 and weakening MACD lead to a breakdown through the EMA cluster and SMA 50. Trigger: close below $8.59 with CMF falling below 0.05. Target: $7.95–$8.20 (lower Bollinger Band and VWAP area). Invalidation: reclaim of $9.00 on rising volume. (25% probability)
PRICE TARGETS
For a 48-day horizon (roughly 7 weeks), the range width should be about 12–18% of the current price, so I used about 17%.
- Target Price: $9.30
- Expected Range: $8.25 to $9.80 (width $1.55, about 17.4% of $8.90, in line with the 30–60 day guidance)
- Key Levels: Support at $8.70 (EMA 55; SMA 50 at $8.59 and VWAP at $8.20 lie below), Resistance at $9.60 (recent highs, upper Bollinger Band at $9.78)
OVERALL BIAS
OVERALL BIAS: BULLISH - Price is above every major moving average with a golden cross in place, CMF shows persistent accumulation (0.185), +DI leads −DI and MACD is above its signal line. Weak ADX (16.9) and the resistance at $9.5–$9.8 limit conviction, so the expected gain is modest.
This is educational analysis and not financial advice.