BB 62-day bullish forecast — Nov 15, 2026
- Bias: Bullish
- Timeframe: 62 days (made Nov 15, 2026, target date Jan 15, 2027)
- Price at analysis: $8.90
- Price target: $9.50
- Expected range: $7.95 – $10.15
- Result: Pending — graded after the close on Jan 15, 2027
Get a free AI analysis of BB today
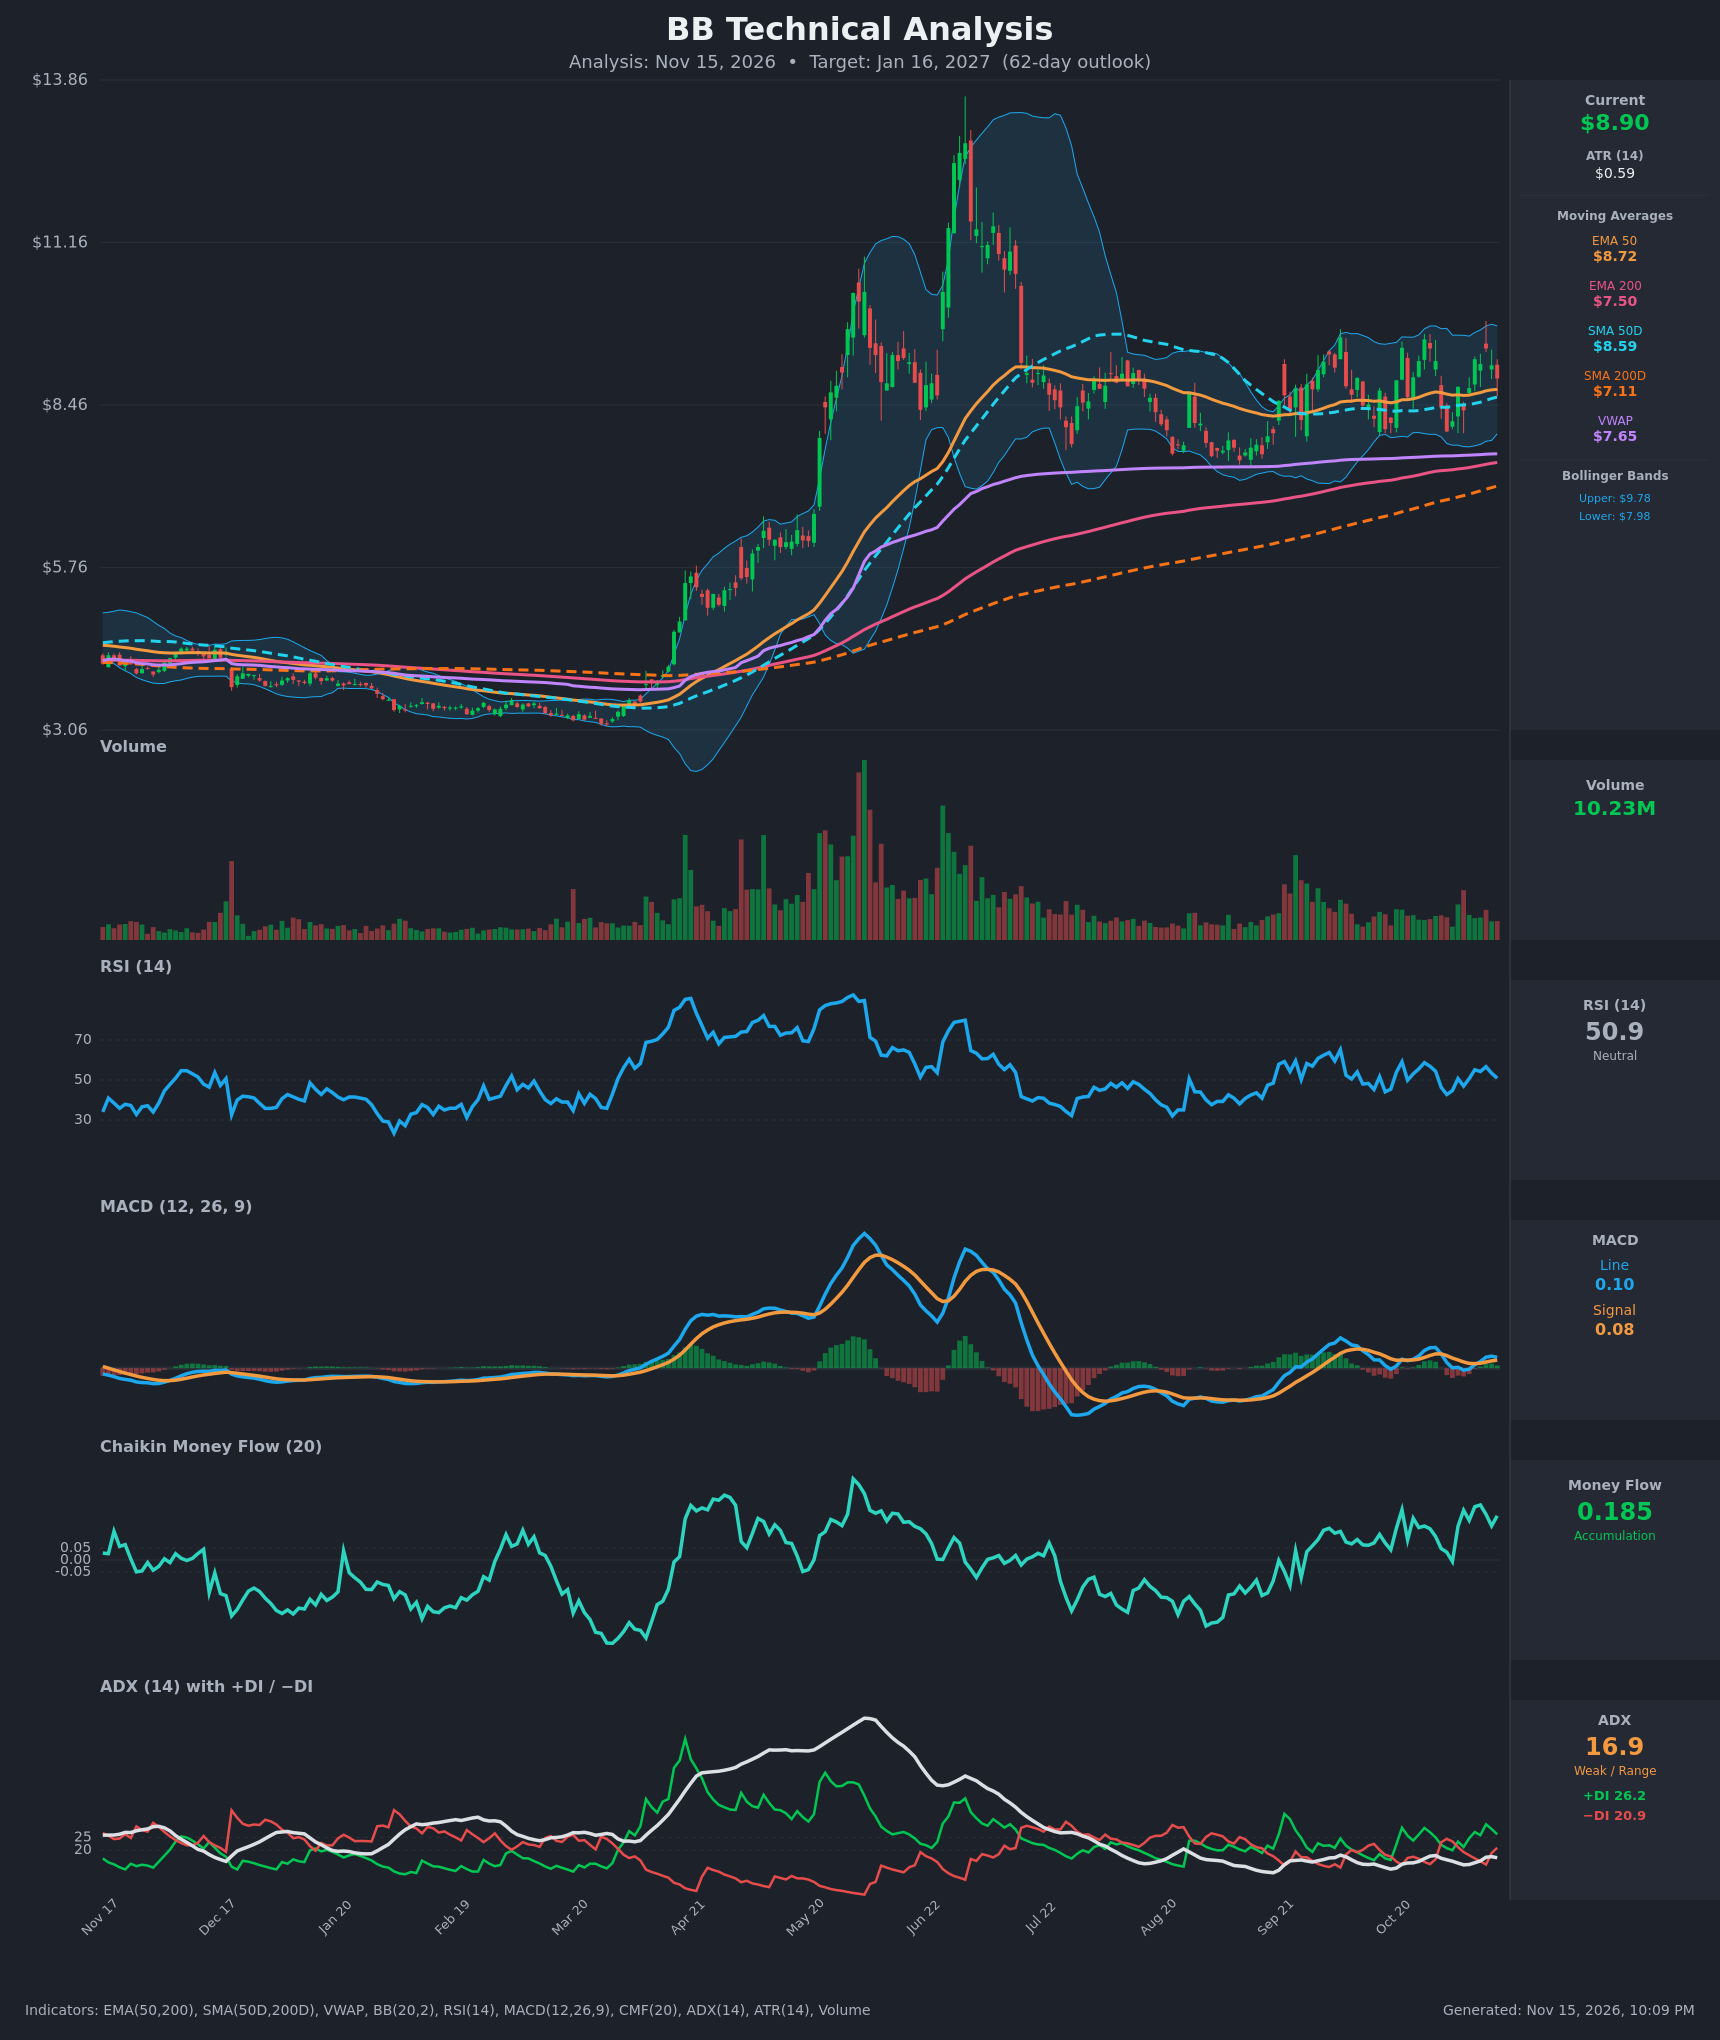
Analysis
TECHNICAL INDICATORS
- RSI (14): 50.92, dead neutral. It has oscillated between about 43 and 59 for the last 15 bars, and the 46 to 58 band since September shows no momentum edge. It is well off the 70+ readings from the spring. [Neutral]
- 20 EMA: Not supplied. The Bollinger midline (20-period basis) is about $8.88, so price at $8.90 sits right on it. The EMA 50 at $8.72 and SMA 50D at $8.59 sit just below as layered support, and both are rising. [Neutral]
- MACD: Line 0.104 is above signal 0.077, so the histogram is slightly positive at about +0.027. The line crossed back above the signal around Nov 9-10 after a dip below zero. The histogram has narrowed over the last two bars (0.045 to 0.027), so momentum is positive but fading. [Bullish]
- Bollinger Bands (20): Upper $9.78, lower $7.98, midline about $8.88. Price is mid-band, and the bands have a moderate width of about 20% of price. There is no squeeze and no band walk, which fits a range. The upper band at about $9.78 matches the recent highs near $9.55-$9.75. [Neutral]
- CMF (20): 0.185, well above +0.05, and positive for most of the last 15 bars (peak 0.230). Buying pressure is persistent even while price chops sideways, which is a mildly constructive divergence. [Accumulation]
- ADX (14): 16.9 and drifting in the 14-17 zone, so there is no trend. +DI at 26.2 is above −DI at 20.9, so bulls have a slight directional edge, but ADX is below 20 and this is a range-bound market. [Weak Trend, Bullish lean]
- Volume: 10.23M, in line with the muted base volume seen since July and well below the spring spike volume. There is no climactic participation in either direction, and up days have not been decisively heavier than down days. [Neutral]
Moving average structure:
- Price is above the EMA 50, EMA 200 ($7.50), SMA 50D, SMA 200D ($7.11) and VWAP ($7.65), so the long-term trend is up.
- EMA 50 is well above EMA 200, and SMA 50D ($8.59) is well above SMA 200D ($7.11). The golden cross is long established and the spreads are widening, which is a bullish structure.
DIVERGENCES & TRENDS
- CMF vs. price: CMF is climbing to 0.18-0.23 while price is stuck between about $7.40 and $9.60. This is accumulation without a breakout yet, a mild bullish divergence.
- RSI/MACD vs. price: There is no meaningful divergence. Price made a higher swing high near $9.55 on Oct 27 and then $9.40 on Nov 11, with the MACD line peaking at 0.199 and then 0.116. That shows slightly weaker momentum on the second push, a minor caution.
- MACD: The line crossed below the signal on Oct 30 and back above around Nov 9-10, a whipsaw typical of a range. The histogram is flattening.
- DI: +DI crossed above −DI again on Nov 4 and has held. −DI is rising from 14 to 21 over the last three bars, a sign of fresh selling on the Nov 12-13 pullback.
- Trend of lows: The lows run $7.40 (Aug-Sept), then roughly $7.9-$8.0 (Nov 2), a sequence of higher lows. The highs are capped at $9.4-$9.6.
- Moving averages: The 50-day averages are rising and have turned up after flattening, and the 200s are rising steadily. Price is holding above all of them.
CHART PATTERNS
- Ascending triangle / rectangle consolidation (continuation): Since July, price has built a base of higher lows against flat resistance near $9.55-$9.80. This resembles the Ascending Triangle in the reference diagram, with the flat-top variant bounded by the $9.78 upper Bollinger Band. Weak ADX means it is still a range until proven otherwise.
- Post-spike base: After the spring run to about $13 and the retracement, the stock is basing above the 200-day averages, a classic digestion pattern.
- Target: A breakout above about $9.80 gives a measured move equal to the pattern height (roughly $9.80 minus $7.40, or about $2.40), which points toward about $11-$12. That is outside the 62-day base case. A realistic partial move is about $10.00-$10.50.
- Invalidation: A close below $8.00, the Nov 2 low and lower Bollinger Band, would turn this into a rectangle or a rising-wedge-style failure.
POTENTIAL SCENARIOS
- Scenario 1: Bullish Range Breakout — Accumulation (CMF 0.185) and higher lows push price through the $9.60-$9.78 ceiling, with +DI above −DI and MACD holding above its signal line. Trigger: daily close above $9.80 on rising volume. Target: $10.40, with an extension toward $11.00. Invalidation: close back below $8.60 (SMA 50D). (45% probability)
- Scenario 2: Neutral Range Chop — ADX stays below 20 and price oscillates between about $8.00 and $9.60 around the 50-day averages. Trigger: repeated rejections at about $9.60 and bounces at about $8.50. Target: $8.60-$9.20. Invalidation: a close outside $7.90-$9.80. (30% probability)
- Scenario 3: Bearish Breakdown — The MACD histogram turns negative, −DI crosses above +DI and price loses the 50-day averages. Trigger: close below $8.00 (lower Bollinger Band and Nov 2 low). Target: $7.40-$7.50 (prior lows, EMA 200 and VWAP). Invalidation: reclaim of $8.75. (25% probability)
PRICE TARGETS
- Target Price: $9.50 (62-day, Jan 16, 2027)
- Expected Range: $7.95 to $10.15 (width $2.20, about 24.7% of the current price, within the 18-30% guide for 61-180 days. Roughly 2 ATR of drift scaled over about 3 months.)
- Key Levels: Support at $8.59 (SMA 50D, with the $8.00 Bollinger low and Nov 2 low behind it), Resistance at $9.78 (upper Bollinger Band and the top of the recent range)
OVERALL BIAS
OVERALL BIAS: BULLISH - Price is above every moving average, with a widening golden-cross structure, higher lows, and persistent CMF accumulation (0.185), plus +DI above −DI and MACD above its signal line. The low ADX (16.9) and neutral RSI keep conviction modest, with the $9.60-$9.78 resistance zone as the key hurdle.
This is educational analysis and not financial advice.