BB 27-day bullish forecast — Nov 15, 2026
- Bias: Bullish
- Timeframe: 27 days (made Nov 15, 2026, target date Dec 11, 2026)
- Price at analysis: $8.90
- Price target: $9.20
- Expected range: $8.35 – $9.75
- Result: Pending — graded after the close on Dec 11, 2026
Get a free AI analysis of BB today
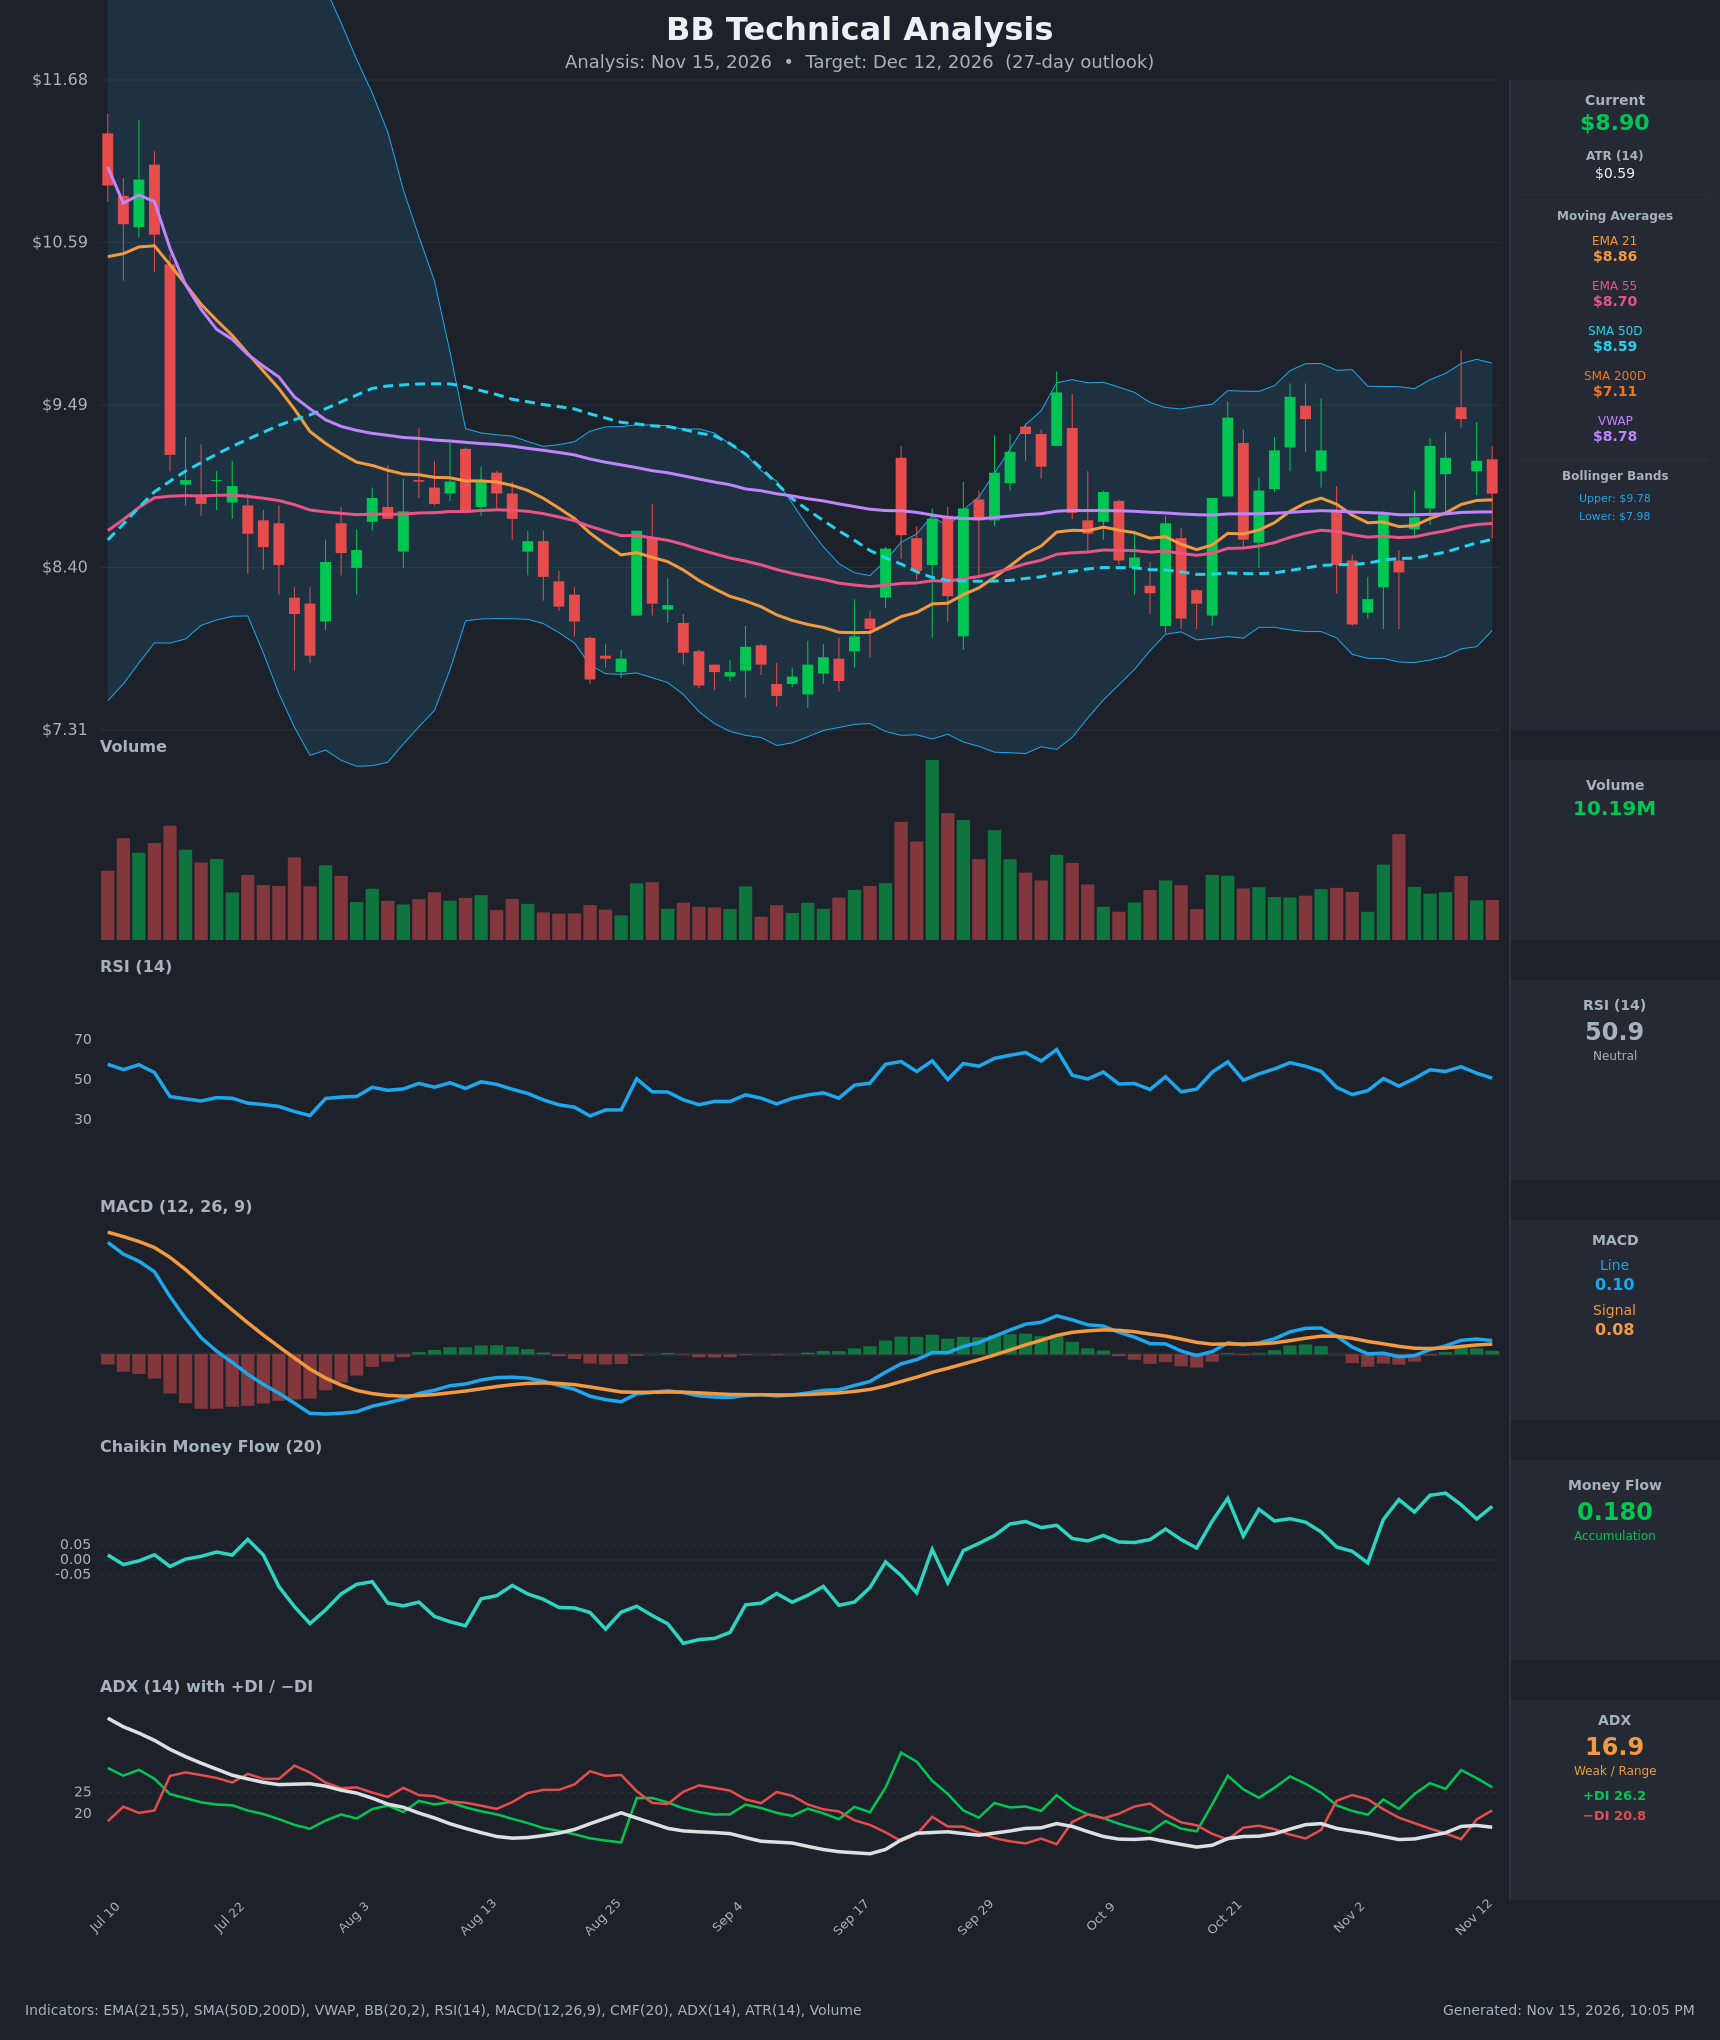
Analysis
TECHNICAL INDICATORS
- RSI (14): 50.92, dead neutral. It has eased from 56.7 on Nov 11 while price pulled back from $9.40 to $8.90, and it has oscillated between 43 and 59 for six weeks without reaching overbought or oversold. [Neutral]
- 20 EMA (EMA 21 = $8.8575): Price at $8.90 is only slightly above the EMA21, so it is acting as marginal support. EMA21 is above EMA55 ($8.70) and rising, so the short-term structure is intact. The Nov 13 close is the weakest of the last four sessions. [Bullish]
- MACD: Line 0.104 is above signal 0.077, giving a small positive histogram of about +0.027. The bullish crossover on Nov 9-10 is still in force, but the line has flattened (0.116 to 0.104) and the histogram is shrinking. Momentum is positive but fading. [Bullish]
- Bollinger Bands (20): Upper $9.78, lower $7.98, midline about $8.88. Price sits almost exactly on the midline, so there is no band-based edge. The bands are flat and moderately wide, which fits a range. The $9.55 high on Oct 27 stalled below the upper band. [Neutral]
- CMF (20): 0.180, well above +0.05 and near the top of its recent range. It has stayed positive since mid-Sept, which points to sustained accumulation even as price chops sideways. [Accumulation]
- ADX (14): 16.9, below 20, so there is no established trend. +DI (26.2) is above −DI (20.8), giving bulls a slight directional edge. The spread has narrowed from 30.2 vs 14.1 on Nov 11. [Weak Trend, mild bullish lean]
- Volume: 10.19M, average to slightly below average. There are no capitulation or breakout spikes since the late-Sept surge, so participation is muted. The Oct 27 and Nov 11 pushes to $9.40-$9.55 came on ordinary volume and were sold. [Neutral, no confirmation]
Moving-average structure is constructive overall:
- Price is above EMA21 ($8.86), EMA55 ($8.70), SMA50D ($8.59), SMA200D ($7.11) and VWAP ($8.78).
- SMA50D is well above SMA200D, so the golden cross is long established and the long-term trend is up.
- The stack is ordered EMA21 > VWAP > EMA55 > SMA50 > SMA200, which is a bullish alignment.
DIVERGENCES & TRENDS
- CMF has made higher highs (0.13 to 0.23 over Oct-Nov) while price has stayed inside $8.0-$9.5. This is a mild bullish divergence, meaning buyers are absorbing supply.
- The MACD histogram is shrinking and RSI has rolled over from 56.7 to 50.9 while price has dropped back to the EMA21. Short-term momentum is cooling, which suggests a retest of support before any breakout.
- Price has made a higher low: about $7.50 in early Sept, then $8.02 on Nov 2. The highs near $9.4-$9.55 are flat, so the range is tightening upward.
- The DI spread narrowed from +16 to +5 over the last two sessions, and ADX is under 20. This is a range environment, not a trend.
- On Oct 30 the MACD crossed down and −DI briefly crossed above +DI. Both reversed by Nov 4-9, so that dip was bought.
CHART PATTERNS
- Ascending Triangle / Bullish Triple Top reference (best fit, with caveats): Highs near $9.35-$9.55 (Sept, Oct 27, Nov 11) form a roughly flat ceiling, and the lows are rising ($7.50 to $8.02). A decisive close above about $9.55-$9.60 would confirm it. The measured move is the pattern height of about $1.50-$1.60 added to the breakout, giving roughly $11.00. That is beyond 27 days, so a partial move to about $10.00 is the realistic horizon.
- Rectangle range: The ceiling is $9.55 and the floor is $8.0 (the Nov 2 low). Price is mid-range, and a rectangle breakout needs volume that isn't there yet.
- The bearish triple top is not confirmed. That would require a close below the Nov 2 low (about $8.0) and a break of the SMA50D.
POTENTIAL SCENARIOS
- Scenario 1: Bullish Range Retest and Upside Push — Price holds the EMA55/VWAP zone and the EMA21, CMF accumulation continues, and BB climbs back toward the top of the range. Trigger: daily close above $9.20, then above $9.55 on volume above 12M. Target: $9.40-$9.75, with an extension to $10.00 on a clean breakout. Invalidation: daily close below $8.55. (45% probability)
- Scenario 2: Neutral Range Chop — Weak ADX keeps price between $8.4 and $9.4 with repeated tests of the EMA21 and midline. Trigger: failure at $9.4-$9.55 combined with a bounce at $8.6-$8.7. Target: $8.70-$9.15. Invalidation: close above $9.60 or below $8.40. (33% probability)
- Scenario 3: Bearish Breakdown — The MACD signal cross turns down, price loses EMA55 and SMA50D, and the range low is tested. Trigger: daily close below $8.55 with MACD below signal and −DI back above +DI. Target: $8.00-$8.20, then the lower Bollinger Band near $7.98. Invalidation: reclaim of $9.00. (22% probability)
PRICE TARGETS
- Target Price: $9.20 (27-day, Dec 12, 2026)
- Expected Range: $8.35 to $9.75. Width is $1.40, about 15.7% of the $8.90 price, which fits the 12-18% guidance for 30-60 days and is scaled slightly down for 27 days.
- Key Levels: Support at $8.70 (EMA55, with VWAP at $8.78 just above). Resistance at $9.55 (Oct 27 high close and the top of the range).
OVERALL BIAS
OVERALL BIAS: BULLISH - Price is above every major moving average with a bullish MA stack, CMF shows sustained accumulation at 0.18, +DI is above −DI, and the lows are rising against a flat ceiling near $9.5. Conviction is modest because ADX is weak, MACD momentum is fading and volume is unconfirmed, so the likely path is a retest of support before a push toward $9.20 or higher.
This is educational analysis and not financial advice.