BB 83-day bullish forecast — Nov 15, 2026
- Bias: Bullish
- Timeframe: 83 days (made Nov 15, 2026, target date Feb 5, 2027)
- Price at analysis: $8.90
- Price target: $9.45
- Expected range: $7.70 – $10.00
- Result: Pending — graded after the close on Feb 5, 2027
Get a free AI analysis of BB today
Analysis
TECHNICAL INDICATORS
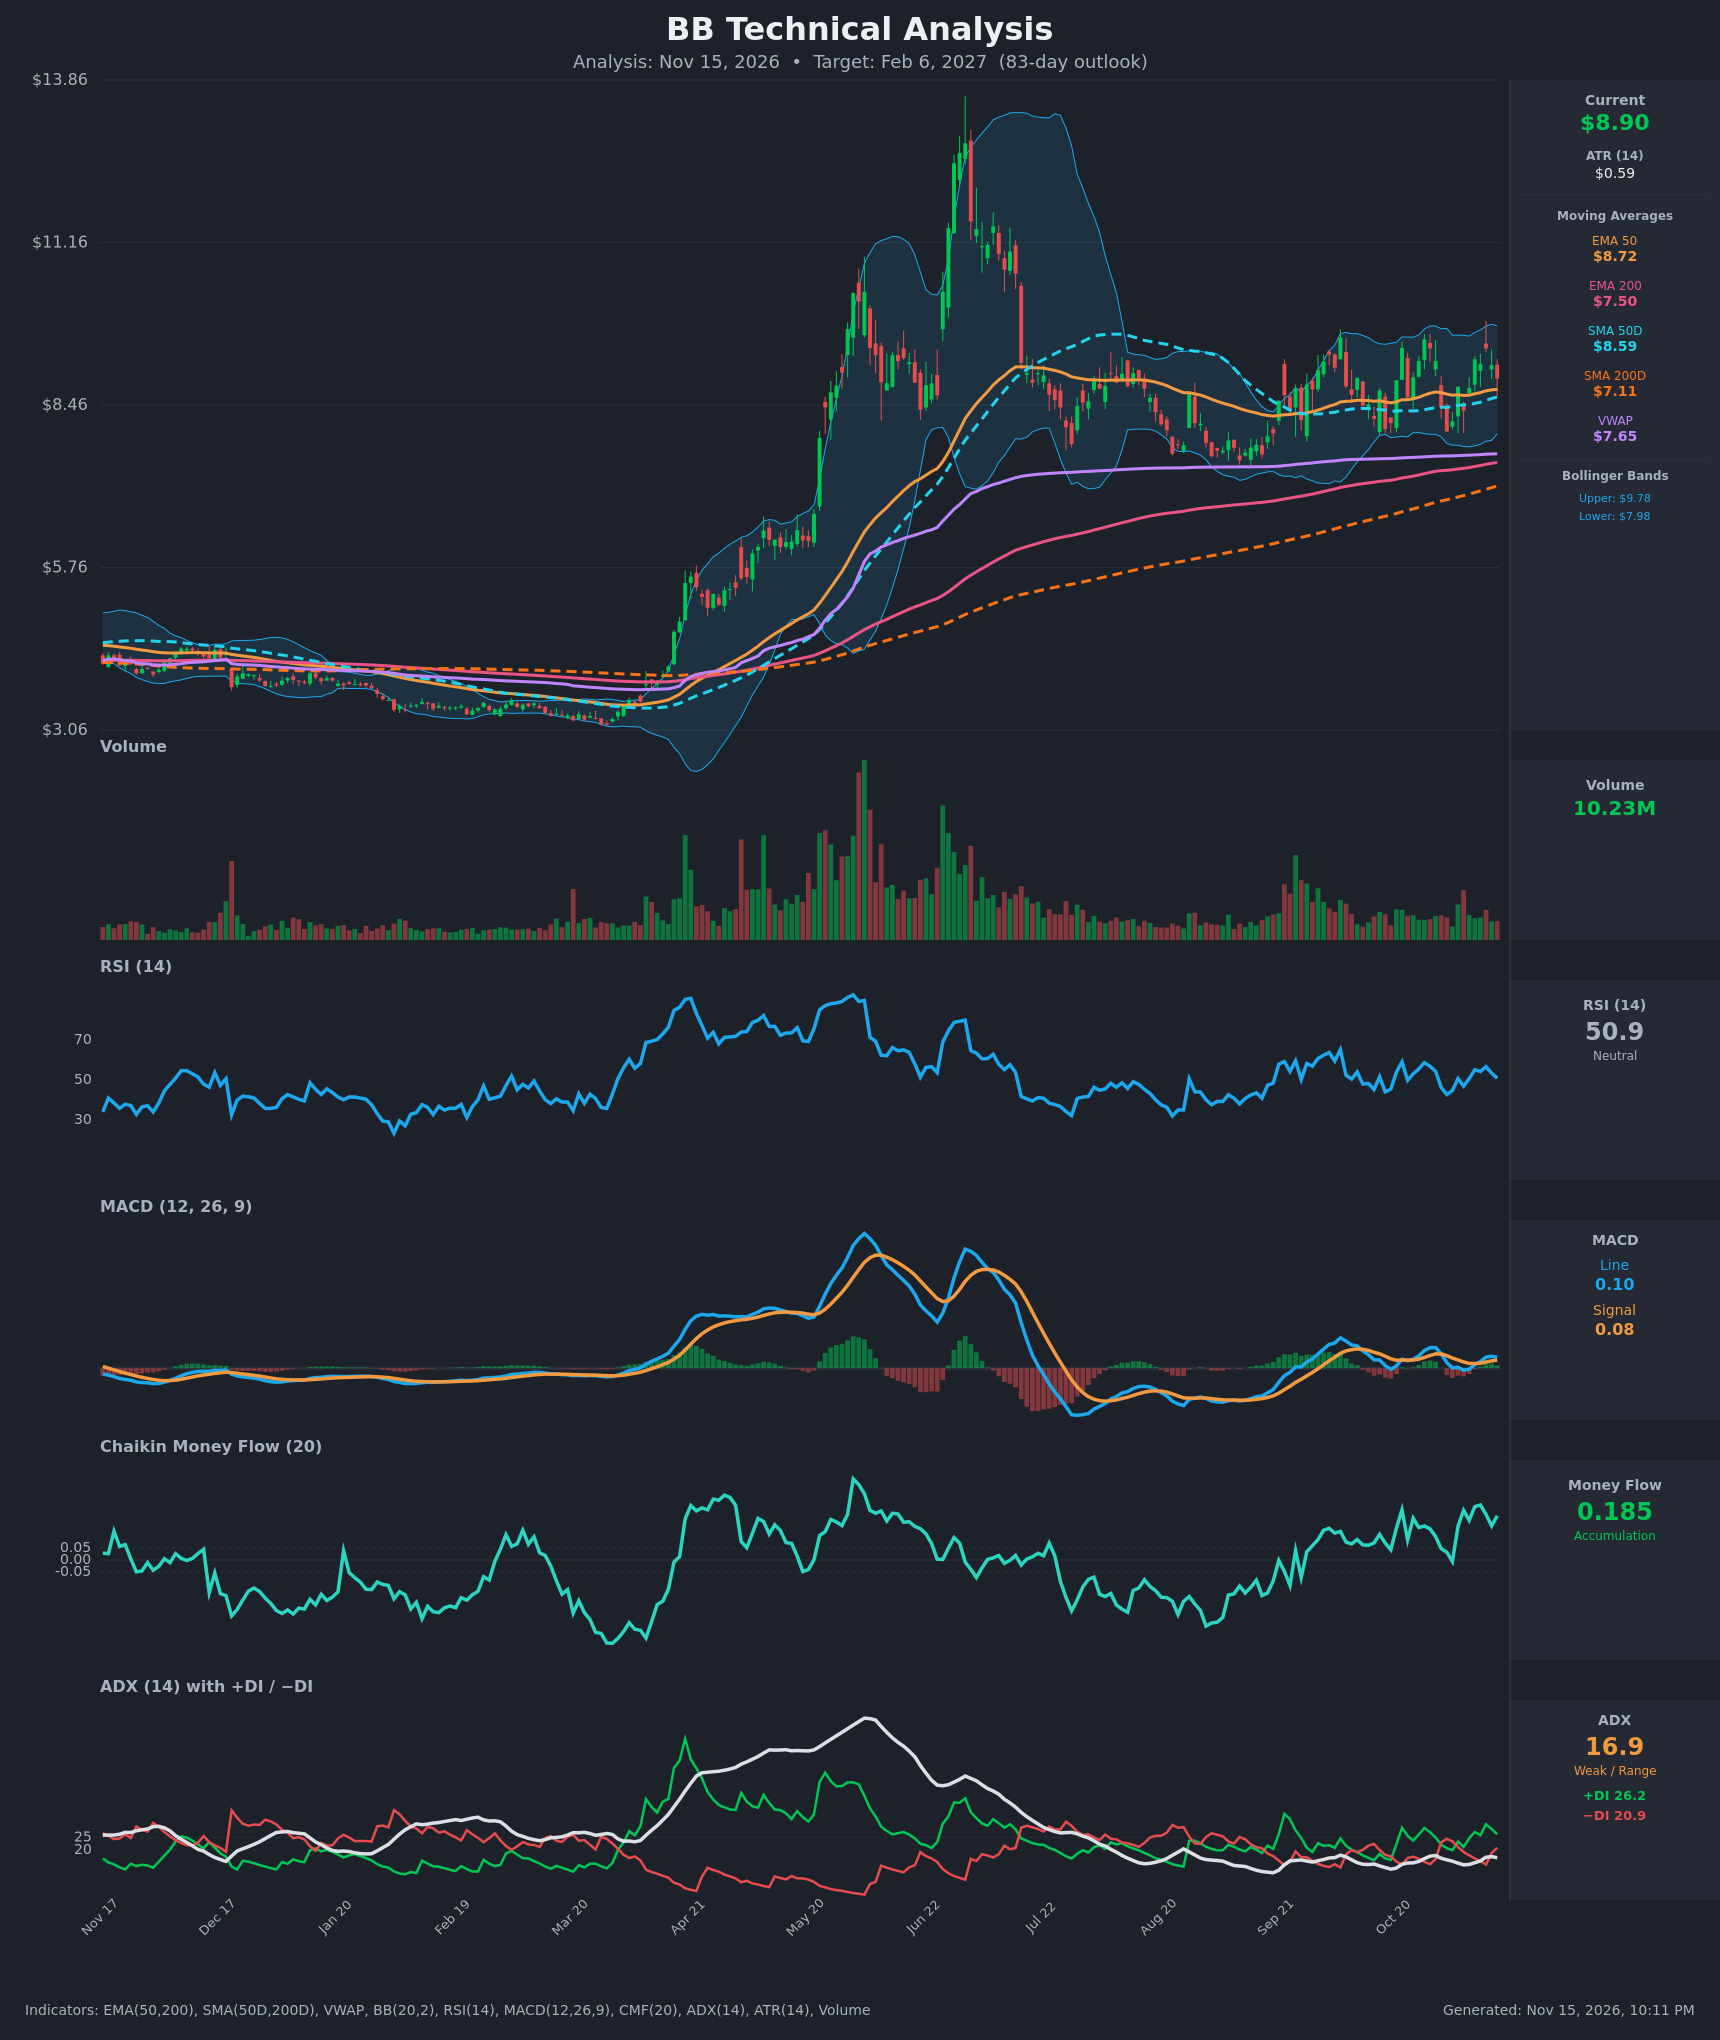
- RSI (14): 50.92, dead neutral. It has oscillated between about 43 and 59 since September and has not reached overbought. It slipped from 56.7 to 50.9 over the last three bars, so short-term momentum is cooling. [Neutral]
- 20 EMA: No 20 EMA value was supplied, so I use the EMA 50 at $8.72 as the nearest dynamic reference. Price at $8.90 is just above it, and the EMA 200 at $7.50 is well below. The short-term trend is mildly positive, but the cushion is thin. [Bullish]
- MACD: Line 0.104 is above Signal 0.077, so the histogram is slightly positive (+0.027). Both lines are near zero, and the line peaked at 0.199 on Oct 29. It crossed down on Oct 30 and crossed back up around Nov 9. This is weak momentum, and the histogram has narrowed over the last two bars. [Neutral]
- Bollinger Bands (20): Upper $9.78, lower $7.98, with the midline near $8.88. Price is pinned at the midline, and the bands are relatively narrow compared with the spring/summer spike. That points to consolidation, with no squeeze breakout yet. [Neutral]
- CMF (20): 0.185, well above +0.05, and positive for most of the last two months. Buying pressure is persisting even though price is flat. That is mild accumulation. [Accumulation]
- ADX (14): 16.9 (below 20), so there is no real trend. +DI 26.2 is above −DI 20.9, which gives a mild bullish lean, though the gap narrowed from 30.3 / 14.2 on Nov 11. [Weak Trend, bullish lean]
- Volume: 10.23M is average to below average compared with the spike-driven volume of April–June. There is no volume expansion on the recent rebounds or the pullbacks. That is consistent with consolidation. [Neutral / low conviction]
Moving-average structure is clearly bullish:
- Price is above the SMA50D ($8.59), SMA200D ($7.11), EMA 50, EMA 200 ($7.50) and VWAP ($7.65).
- The SMA50D crossed above the SMA200D well before the table starts, so the golden cross is long established.
- All of the averages are rising.
DIVERGENCES & TRENDS
- CMF vs. price: CMF has made higher highs since August (0.185 now) while price has moved sideways between about $7.3 and $9.5. This is a mild bullish divergence, with accumulation under a flat price.
- MACD / ADX: MACD has oscillated around zero since August and ADX is below 20. The trend is dormant, and the last two weeks show only whipsaws.
- Failed push: Price made a lower high at $9.55 on Oct 27, below the earlier $9.8–$10 band-top area. It then dropped to $8.02 on Nov 2 and recovered to $9.40 by Nov 11. This is range behavior, with higher lows near $7.3 → $8.0.
- Crossovers: The MACD bearish crossover on Oct 30 reversed on Nov 9. The DI lines crossed bearish on Oct 30 and bullish again on Nov 4. Neither signal held, which fits a choppy market.
- Recent drift: The last three closes ($9.40 → $9.12 → $8.90) show fading momentum. A retest of the $8.6–$8.7 MA cluster is plausible before any move higher.
CHART PATTERNS
- Primary pattern: consolidation (rectangle / ascending-triangle-like base). After the spike to about $13 and the retracement, price has built a range with a support floor rising from about $7.3 to $8.0 and resistance near $9.5–$9.8. That resembles the Ascending Triangle on the reference diagram, which is a bullish continuation pattern, though the rising floor is shallow. Measured move: range height of about $2.2 added to a breakout above $9.8 gives about $11.5–$12, a stretch for 83 days.
- Bearish alternative: The failed push near $9.5 and lower high could also be read as a Bearish Double Top or a topping range. It would only confirm with a close below roughly $8.0, which is also the lower band and the prior pivot low.
- Overall: The structure is a neutral-to-bullish continuation base above rising long-term averages. The bullish read is not confirmed until price breaks and holds above $9.8.
POTENTIAL SCENARIOS
- Scenario 1: Bullish Range Breakout — Rising averages, positive CMF and +DI dominance carry price through resistance as the base completes. Trigger: daily close above $9.80 on rising volume. Target: $10.50–$11.50 (partial measured move). Invalidation: close back below $8.60 (SMA50D/EMA 50). (45% probability)
- Scenario 2: Neutral Continued Range — Price chops between $8.0 and $9.6 with ADX below 20 and no resolution. Trigger: repeated rejections near $9.5 and bounces near $8.0–$8.6. Target: $8.50–$9.30 at the 83-day mark. Invalidation: a close beyond $9.80 or below $7.90. (30% probability)
- Scenario 3: Bearish Range Breakdown — Momentum fades, the lower high holds, and price loses the MA cluster and the range floor. Trigger: close below $8.00 (lower band and prior pivot low). Target: $7.40–$7.65 (VWAP / EMA 200 zone). Invalidation: reclaim of $8.70 on volume. (25% probability)
PRICE TARGETS
- Target Price: $9.45 (83-day horizon)
- Expected Range: $7.70 to $10.00 (width $2.30, about 25.8% of current price, consistent with the 61–180 day guidance of 18–30%)
- Key Levels: Support at $8.59 (SMA50D; EMA 50 at $8.72 is just below price, and the lower Bollinger Band at $7.98 is the next floor), Resistance at $9.78 (upper Bollinger Band, near the $9.55 high)
OVERALL BIAS
OVERALL BIAS: BULLISH - Price is above every moving average, the golden cross is intact, CMF shows sustained accumulation and +DI leads −DI. The low ADX and flat range cap conviction, so the expected gain is modest, with a target of about $9.45.
This is educational analysis and not financial advice.