BB 34-day bullish forecast — Nov 15, 2026
- Bias: Bullish
- Timeframe: 34 days (made Nov 15, 2026, target date Dec 18, 2026)
- Price at analysis: $8.90
- Price target: $9.20
- Expected range: $8.20 – $9.70
- Result: Pending — graded after the close on Dec 18, 2026
Get a free AI analysis of BB today
Analysis
TECHNICAL INDICATORS
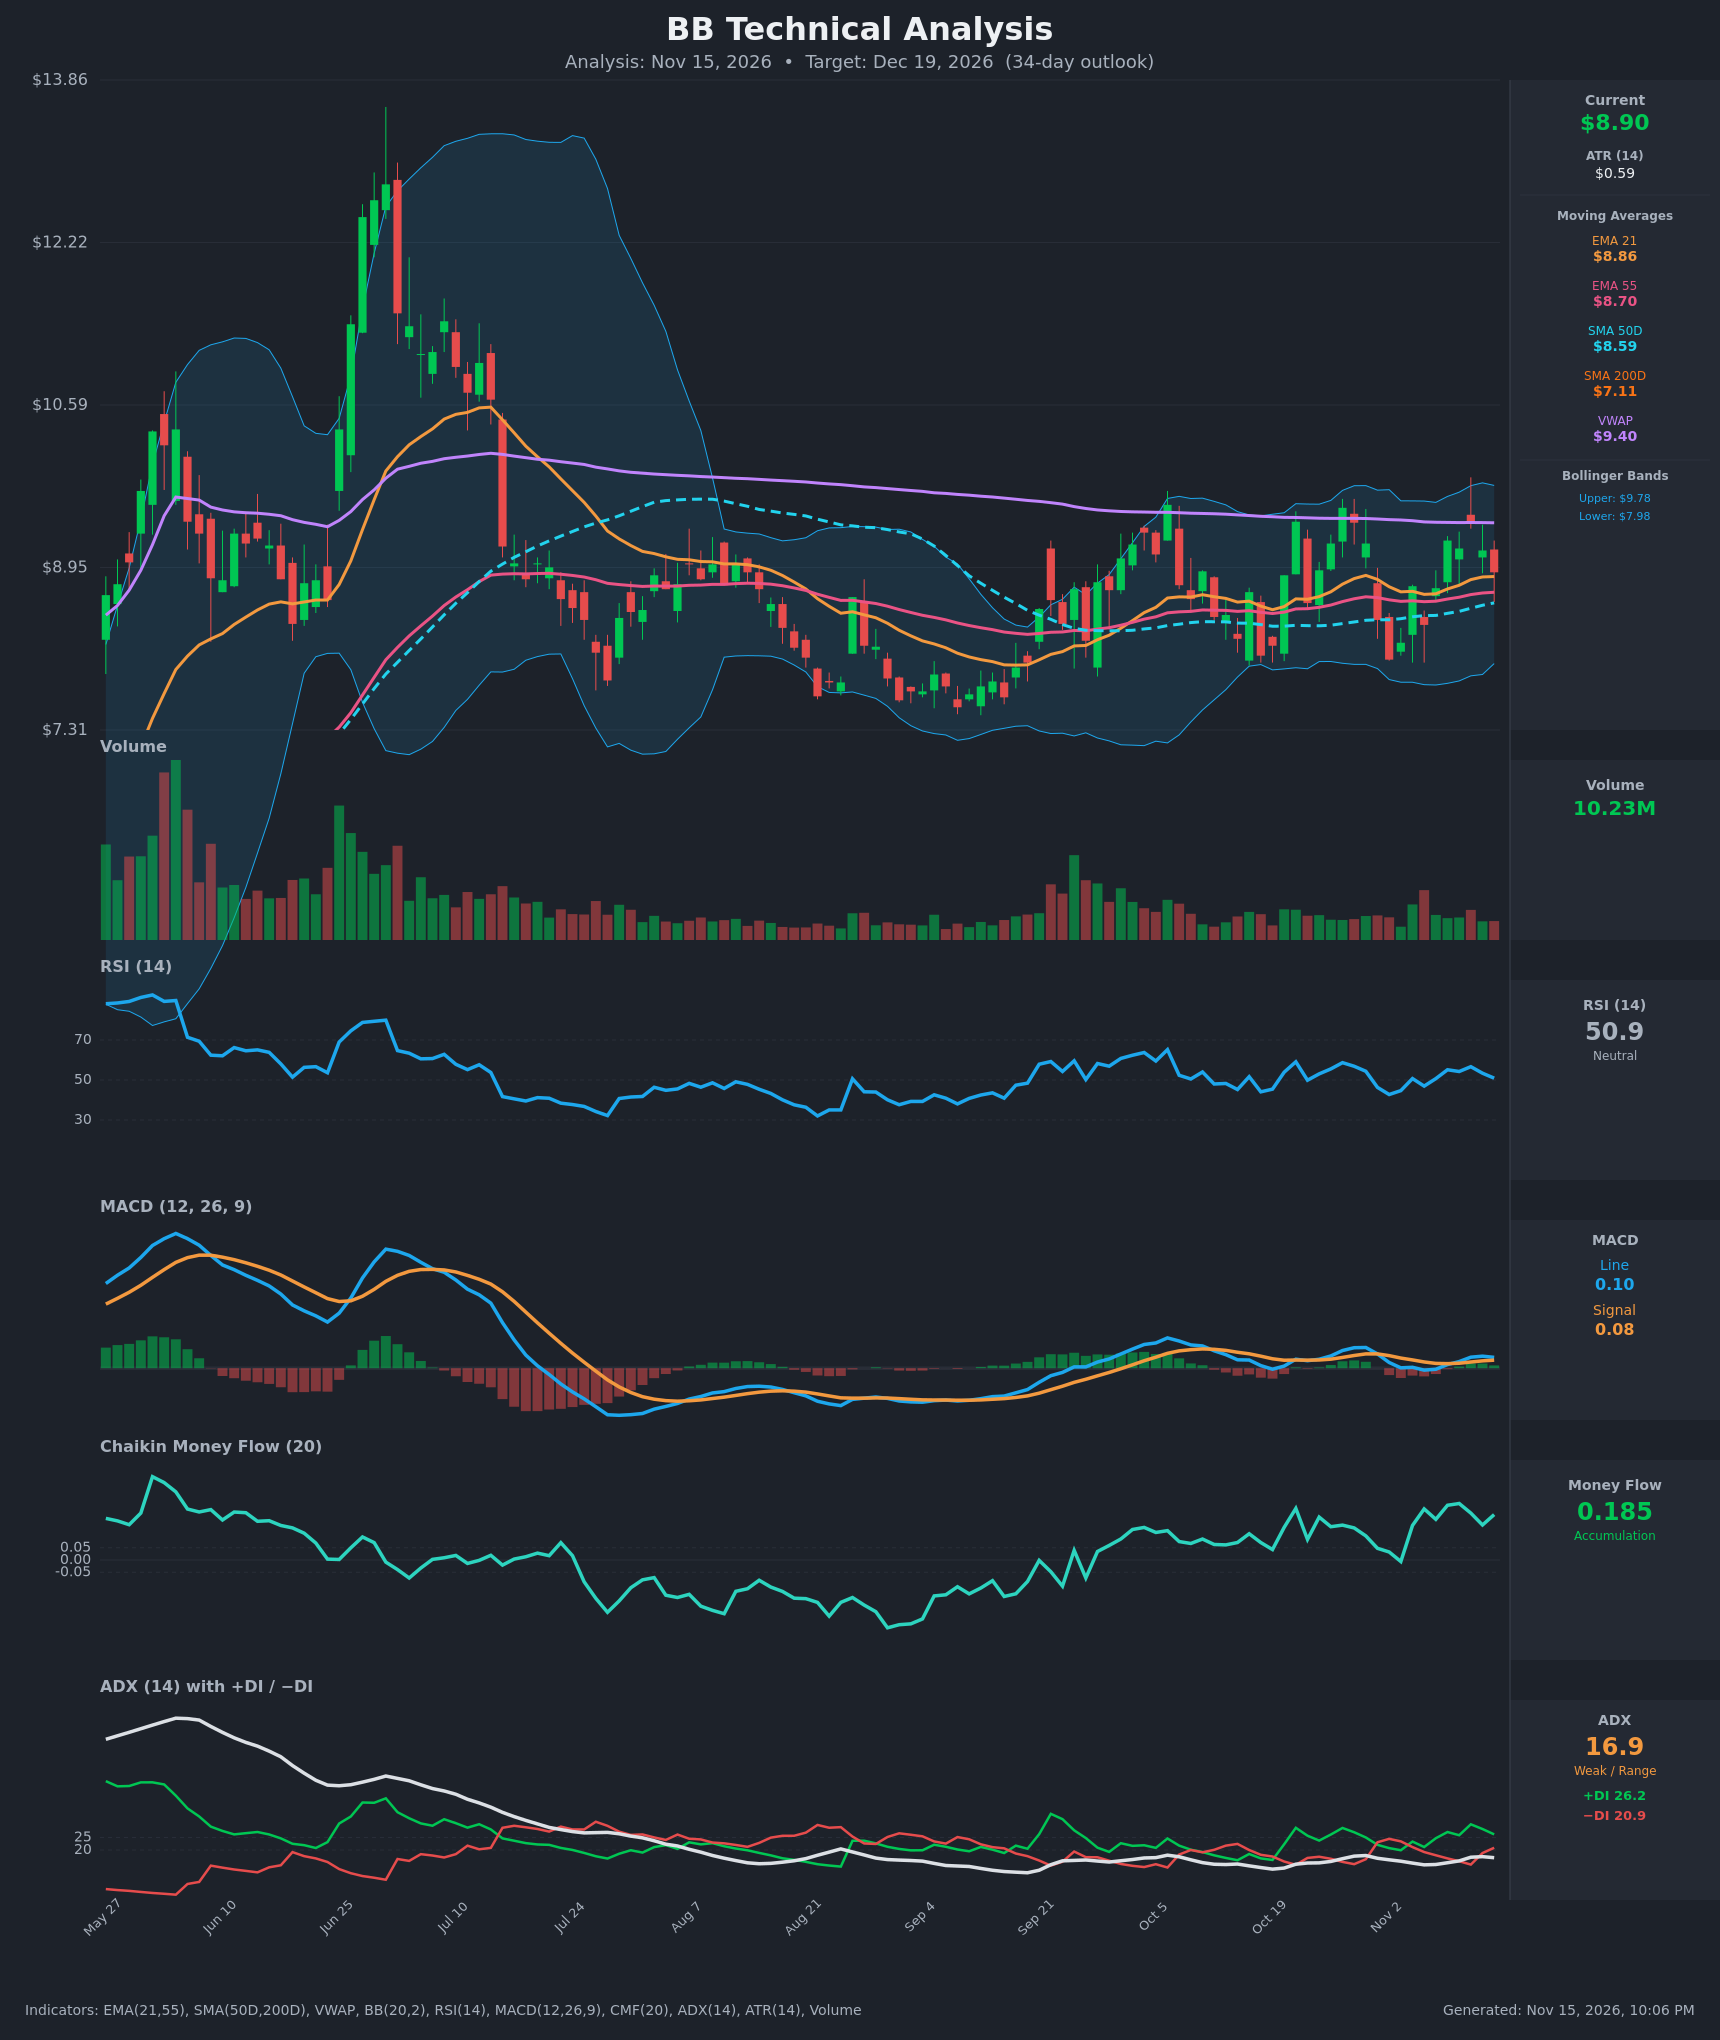
- RSI (14): 50.92, dead neutral. It has faded from 56.7 on Nov 11 but has held between 42 and 58 for the past two weeks. There is no overbought or oversold signal, and momentum is flat to slightly softening. [Neutral]
- 20 EMA (EMA 21): $8.8575. Price at $8.90 is just above it, so the EMA is marginal support. EMA21 is above EMA55 ($8.70), which keeps the short-term trend structure positive. Price has been oscillating around the EMA21 for weeks. [Bullish]
- MACD: The line (0.104) is above the signal (0.077), a mild positive histogram of about +0.027. The line crossed back above the signal around Nov 9–10 after a brief dip below zero. Both lines are hugging the zero line, so momentum is positive but weak. [Bullish]
- Bollinger Bands (20): Upper $9.78, lower $7.98, middle about $8.88. Price sits right at the midline, with the bands moderately narrow versus the summer. Price has repeatedly failed near the upper band (about $9.4–9.55) and bounced from the lower band (about $8.0–8.4). No directional edge. [Neutral]
- CMF (20): +0.185, well above the +0.05 threshold. It has been positive and rising since Sep, signalling steady accumulation even as price chops sideways. [Accumulation]
- ADX (14): 16.9, weak and range-bound (below 20), and drifting lower. +DI (26.2) is above −DI (20.9), so bulls have the slight edge, but there is no trend strength to confirm it. [Weak Trend, mild bullish lean]
- Volume: 10.23M, near average with no spike. Volume has been subdued since August, apart from a small surge in late September. Neither side is committing, which is consistent with consolidation. [Neutral, no breakout participation yet]
Moving average structure:
- SMA200D: $7.11, well below price. Price is above SMA50D ($8.59), EMA55 and SMA200D, which means a long-term uptrend structure and an old golden cross.
- VWAP: $9.40, about 5.6% above price. It acts as overhead resistance, and price has been unable to reclaim it since July.
DIVERGENCES & TRENDS
- Price vs. CMF: Price has been flat to range-bound since September while CMF made higher highs (0.185 vs. about 0.0 in Sep). This is a mild bullish divergence, since accumulation is outpacing price.
- Higher lows: Swing lows have risen from about $7.5 (Aug) to about $8.0 (Nov 2) and $8.2 (Nov 3). Highs are capped around $9.4–9.55.
- MACD/RSI: No meaningful divergence. Both are neutral-to-slightly-positive, and MACD is consolidating near zero.
- Crossovers:
- MACD bullish recross around Nov 9–10.
- +DI/−DI flipped bearish on Oct 30–Nov 3, then flipped back bullish on Nov 4 and has stayed there.
- EMA21 is above EMA55, and SMA50D is rising toward the EMAs.
- Recent action: Price has pulled back three sessions in a row ($9.40 → $9.12 → $8.90). RSI and MACD momentum are cooling. This is a retest of the EMA21 zone, not a breakdown.
CHART PATTERNS
- Primary pattern: Rectangle / range (resembling the "Bullish Triple Top" range in the reference). Price has oscillated between about $8.0 and $9.5 since September, with repeated rejections near $9.4–9.55. Within the range, the rising lows give it a loose Ascending Triangle character. A close above about $9.55–9.60 on expanding volume would project a measured move of about $1.6 (range height), or roughly $11. A more conservative first target is $10.2–10.5.
- Failure case: A break below $8.0 would invalidate the rising-low structure and open $7.50 and then SMA200D at about $7.11.
- Without a volume expansion or ADX above 20–25, the pattern is not yet confirmed. The most probable path is continued range trading with a mild upward bias.
POTENTIAL SCENARIOS
- Scenario 1: Bullish Range Breakout Attempt — Accumulation (CMF +0.185), the rising-low structure and the positive MACD/+DI lean push price up through the $9.40 VWAP and the $9.55 range top. Trigger: daily close above $9.55 on volume above about 12M. Target: $9.90–$10.40. Invalidation: close back below $8.70 (EMA55). (40% probability)
- Scenario 2: Neutral Range Continuation — Weak ADX and muted volume keep price oscillating between EMA55/SMA50D support and VWAP/upper-band resistance. Trigger: failure to close above $9.55 and holds above $8.60. Target: $8.50–$9.40 range. Invalidation: close outside $8.20–$9.70. (33% probability)
- Scenario 3: Bearish Breakdown — Repeated rejection at VWAP and the upper band leads to a loss of the MA cluster, with a retest of the lows. Trigger: daily close below $8.59 (SMA50D) and then $8.20. Target: $7.95–$8.20, with an extension toward $7.50. Invalidation: reclaim of $9.00 on volume. (27% probability)
PRICE TARGETS
For the 34-day horizon (to Dec 19, 2026), the mild bullish lean from accumulation, the stack of rising moving averages and positive +DI outweighs the resistance at VWAP and the weak ADX. The target is therefore modestly above current price, but not at the range top, because of the overhead supply.
- Target Price: $9.20 (34 days)
- Expected Range: $8.20 to $9.70. Width is $1.50, about 16.9% of current price, which fits the 30–60 day guidance of 12–18%.
- Key Levels: Support at $8.70 (EMA55; SMA50D at $8.59 just below), Resistance at $9.40 (VWAP, with the range top at about $9.55).
OVERALL BIAS
OVERALL BIAS: BULLISH - Price holds above all key moving averages, CMF shows strong accumulation (+0.185), MACD and +DI/−DI lean positive, and swing lows are rising. The bias is modest because ADX is weak (16.9) and price faces resistance at VWAP ($9.40) and the $9.55 range top.
This is educational analysis and not financial advice.