BB 4-day bearish forecast — Oct 31, 2026
- Bias: Bearish
- Timeframe: 4 days (made Oct 31, 2026, target date Nov 3, 2026)
- Price at analysis: $8.41
- Price target: $8.30
- Expected range: $8.15 – $8.60
- Result: Correct (-2.6%) — closed at $8.19 on Nov 3, 2026; quality score 100/100
Get a free AI analysis of BB today
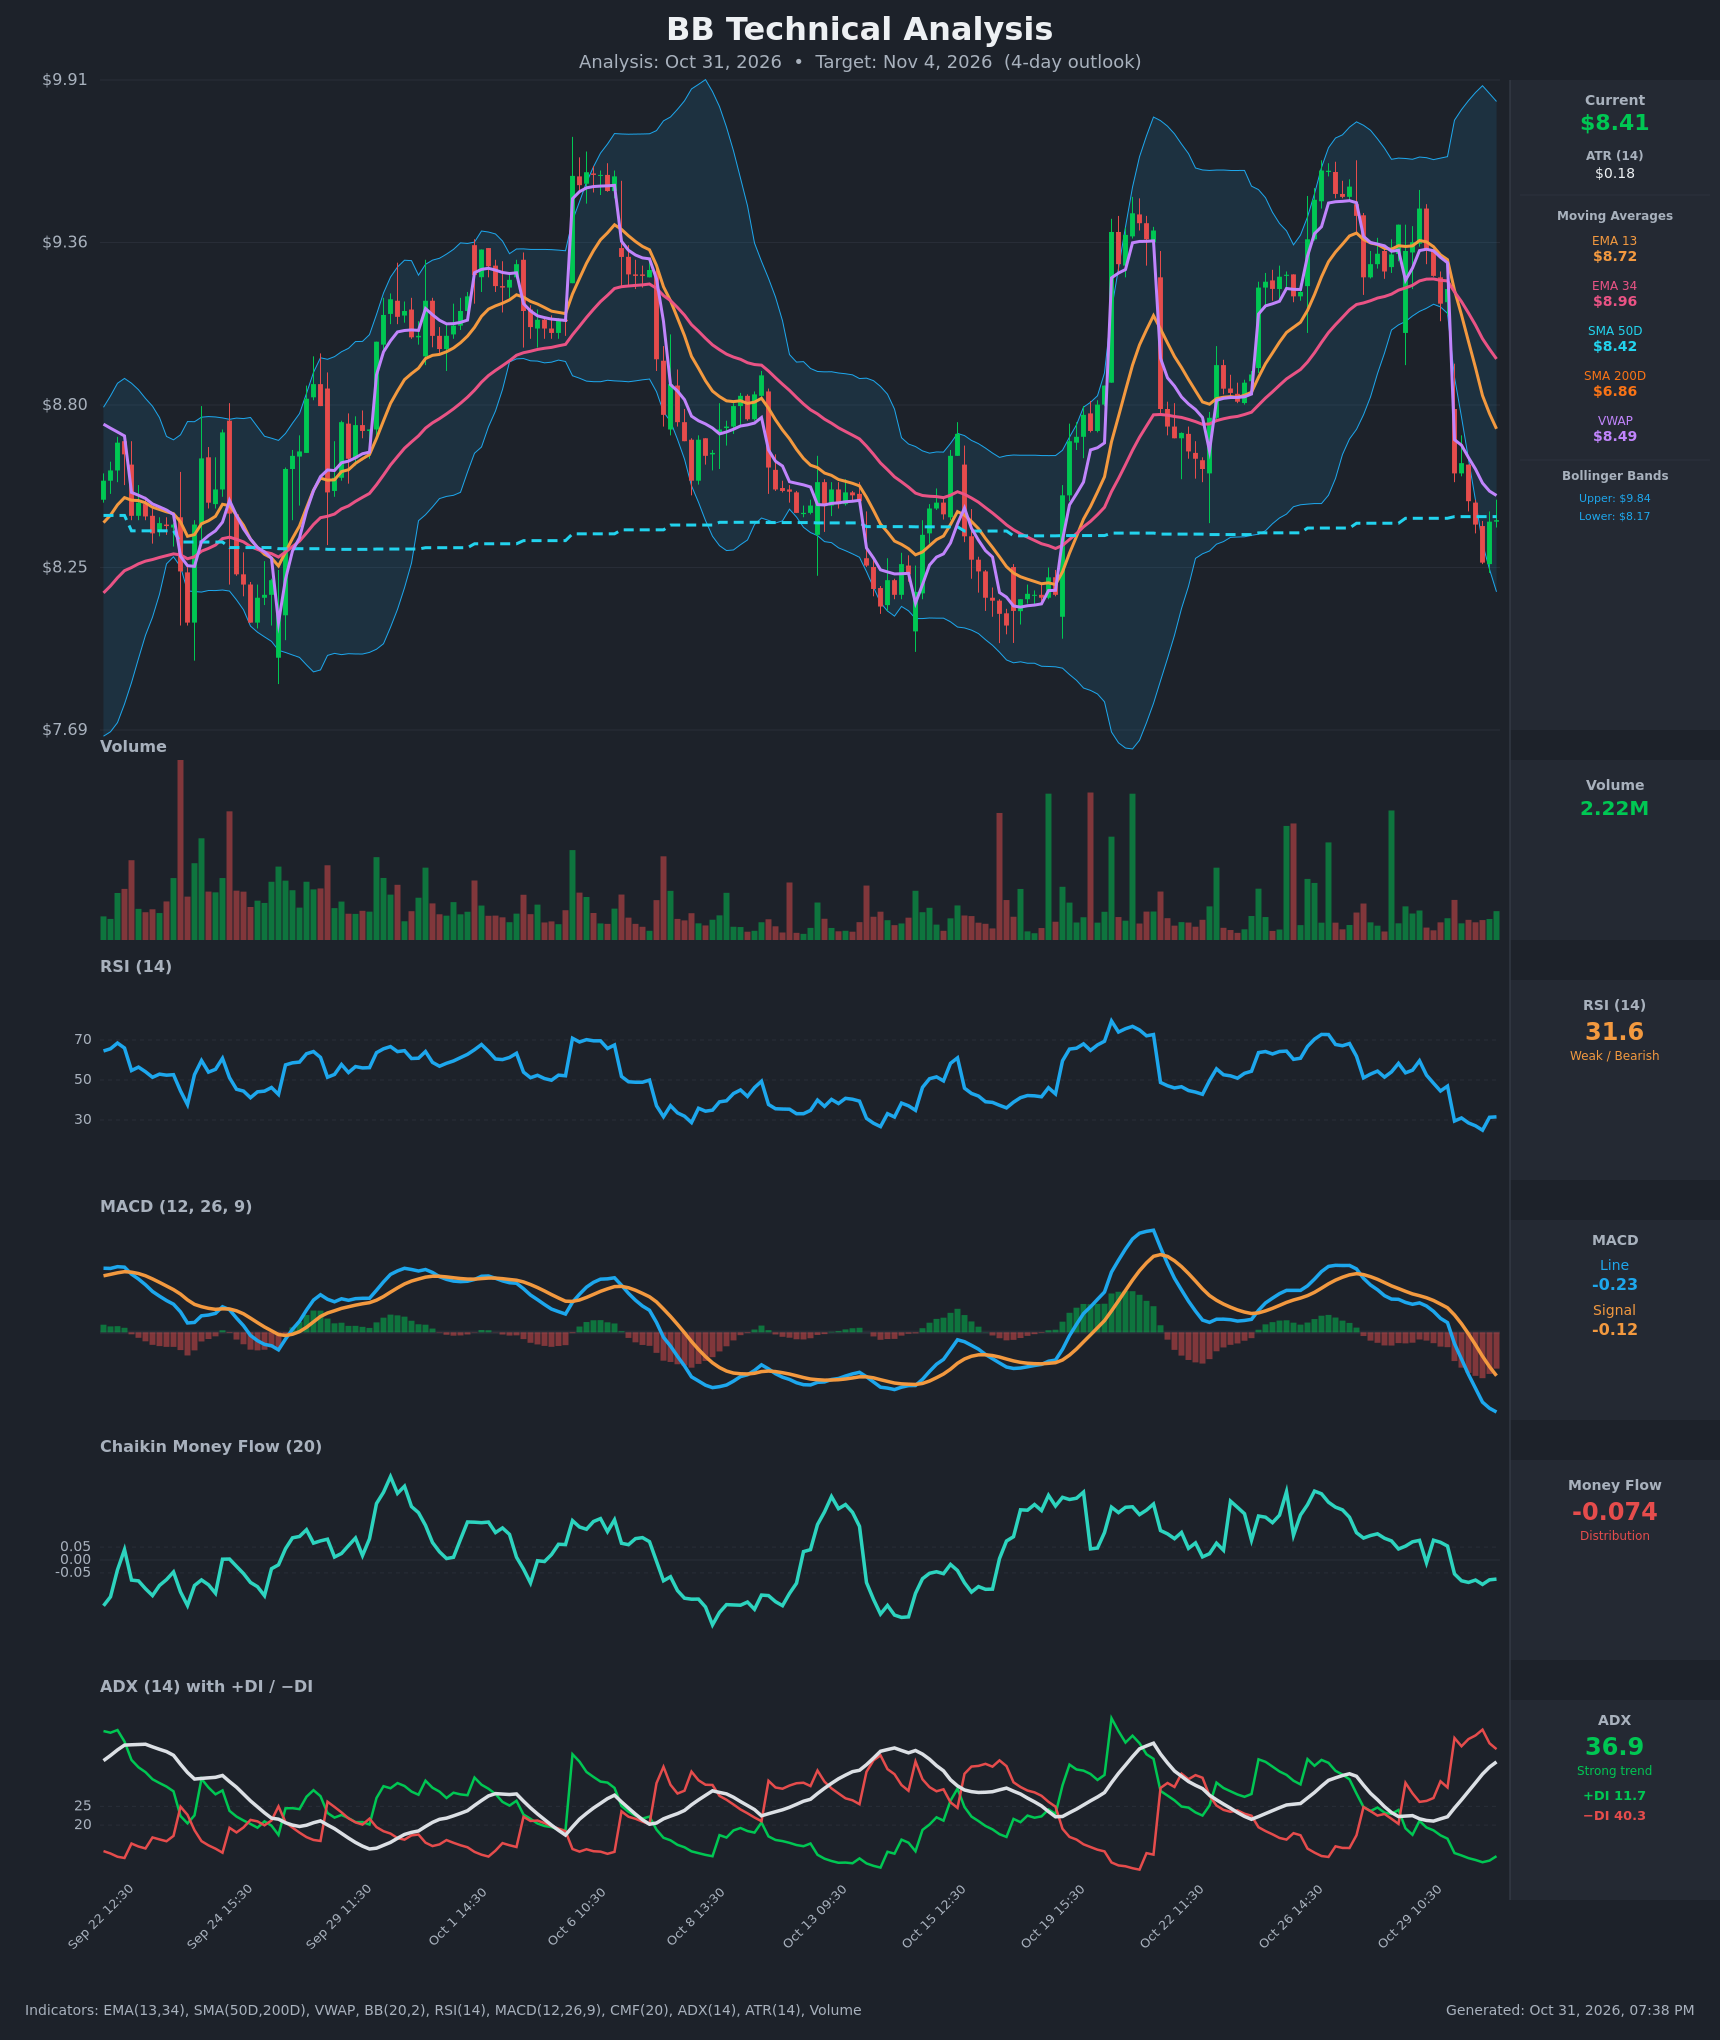
Analysis
TECHNICAL INDICATORS
- RSI (14): 31.58, just off the oversold line after hitting about 25 on Oct 30 and ticking up slightly from there. Momentum is still weak and below 50, and the small uptick is not yet a reversal. [Bearish]
- 20 EMA (EMA 13 / EMA 34 used): EMA 13 is $8.72 and EMA 34 is $8.96, both above the $8.41 price and sloping down. EMA 13 has crossed below EMA 34 (Oct 30 around 11:30), which is a bearish crossover, and both now act as overhead resistance. [Bearish]
- MACD: Line -0.227 sits below signal -0.124, after a bearish crossover on Oct 30 morning. Both lines are below zero, and the negative histogram has been widening for several bars. [Bearish]
- Bollinger Bands (20): Upper $9.84, lower $8.17. Price at $8.41 is in the lower quarter of the bands, about $0.24 above the lower band. The bands are wide from recent volatility, and the price walked down the lower half after the gap. A stretch like this often brings a pause or bounce, but it is not a buy signal on its own. [Neutral]
- CMF (20): -0.074, below the -0.05 threshold and falling from positive readings earlier in the week. This shows distribution and selling pressure. [Distribution]
- ADX (14): 36.9 and rising (from about 22 two sessions ago), with -DI 40.3 far above +DI 11.7. This is a strong, accelerating downtrend with bears firmly in control. [Strong Trend – Bearish]
- Volume: 2.22M, roughly average with no capitulation spike. The drop came on a gap, and the follow-through has been steady rather than climactic. This suggests the selloff may not be exhausted. [Neutral to mildly Bearish]
DIVERGENCES & TRENDS
- There is no bullish RSI or MACD divergence. RSI made a new low (about 25) alongside the price low, then bounced slightly. The momentum indicators confirm the price decline.
- The Oct 30 open at $8.57 was a gap down from $9.20, a sharp break below both EMAs, VWAP and the lower-half Bollinger zone.
- Bearish crossovers: EMA 13 crossed below EMA 34, MACD crossed below signal, and −DI crossed above +DI (now a wide gap). ADX is rising above 25, so trend strength is increasing.
- Price is sitting on SMA50D ($8.42) and holding it for now. It is still well above SMA200D ($6.86), so the long-term trend is up. No golden or death cross is imminent. The 50 SMA is the key near-term floor.
- Price is below VWAP ($8.49), a mild sign of seller control intraday.
- On the chart, previous dips into the $8.10–$8.25 zone (Sep 24, Oct 8–20) attracted buyers, so that zone is a meaningful support area.
CHART PATTERNS
- No single textbook pattern is clean. The best fit is a loose Bearish Double/Triple Top around $9.40–$9.60 (Oct 6, Oct 21 and Oct 28 highs) inside a multi-week range of about $8.10–$9.50. Price has now dropped to the lower part of that range. A decisive break below roughly $8.10–$8.17 would confirm the pattern, and a measured move would aim much lower toward $7.0–$7.5. That is beyond a 4-day horizon, so only the early part of that move is relevant.
- The tight sideways action in the last few bars around $8.40 after the sharp drop resembles a small Bearish Flag/Pennant, a continuation pattern that points lower.
- The counter-argument is that price is at the range floor and the SMA50, with RSI near 30. A relief bounce toward VWAP ($8.49) or EMA 13 ($8.72) is plausible, but it would likely be a lower high within the downtrend.
POTENTIAL SCENARIOS
- Scenario 1: Bearish Trend Continuation — Sellers keep control (ADX 37, −DI 40) and price loses the SMA50 at $8.42, drifting to the lower Bollinger Band and the $8.10–$8.20 support zone. Trigger: a close below $8.35 on rising volume. Target: $8.17 first, then $8.10 or slightly lower. Invalidation: a close back above $8.72 (EMA 13). (50% probability)
- Scenario 2: Bullish Oversold Relief Bounce — RSI around 30 and support at the SMA50 and lower band trigger a mean-reversion bounce, but it stalls under the declining EMAs. Trigger: a reclaim of VWAP at $8.49 with improving CMF. Target: $8.60–$8.72 (EMA 13). Invalidation: a close below $8.30. (35% probability)
- Scenario 3: Neutral Basing Chop — Price consolidates around the SMA50 between $8.25 and $8.55 as the selling pace slows. Trigger: low-volume overlapping candles and RSI flattening in the 30s. Target: $8.35–$8.50. Invalidation: a close outside the $8.20–$8.60 band. (15% probability)
PRICE TARGETS
- Target Price: $8.30 (4-day horizon, Nov 4)
- Expected Range: $8.15 to $8.60 (width $0.45, about 5.4% of the current price, in line with a 4-day timeframe; roughly 2.5 daily ATRs of $0.18 on each side)
- Key Levels: Support at $8.17 (lower Bollinger Band; below that is the $8.10 range floor), Resistance at $8.49 (VWAP; stronger resistance at $8.72, EMA 13)
OVERALL BIAS
OVERALL BIAS: BEARISH - A strongly trending decline (ADX 36.9, −DI 40.3 vs +DI 11.7) with a bearish MACD crossover, EMA 13 below EMA 34, negative CMF and price below VWAP all favor more downside toward the $8.17 band and range support. Oversold RSI and the SMA50 at $8.42 raise the odds of a bounce, but the evidence still leans toward continuation, so the conviction is moderate.
This is educational analysis and not financial advice.