KWEB 4-day bearish forecast — Oct 31, 2026
- Bias: Bearish
- Timeframe: 4 days (made Oct 31, 2026, target date Nov 3, 2026)
- Price at analysis: $22.75
- Price target: $22.58
- Expected range: $22.20 – $23.00
- Result: Incorrect (+2.6%) — closed at $23.35 on Nov 3, 2026; quality score 24/100
Get a free AI analysis of KWEB today
Analysis
TECHNICAL INDICATORS
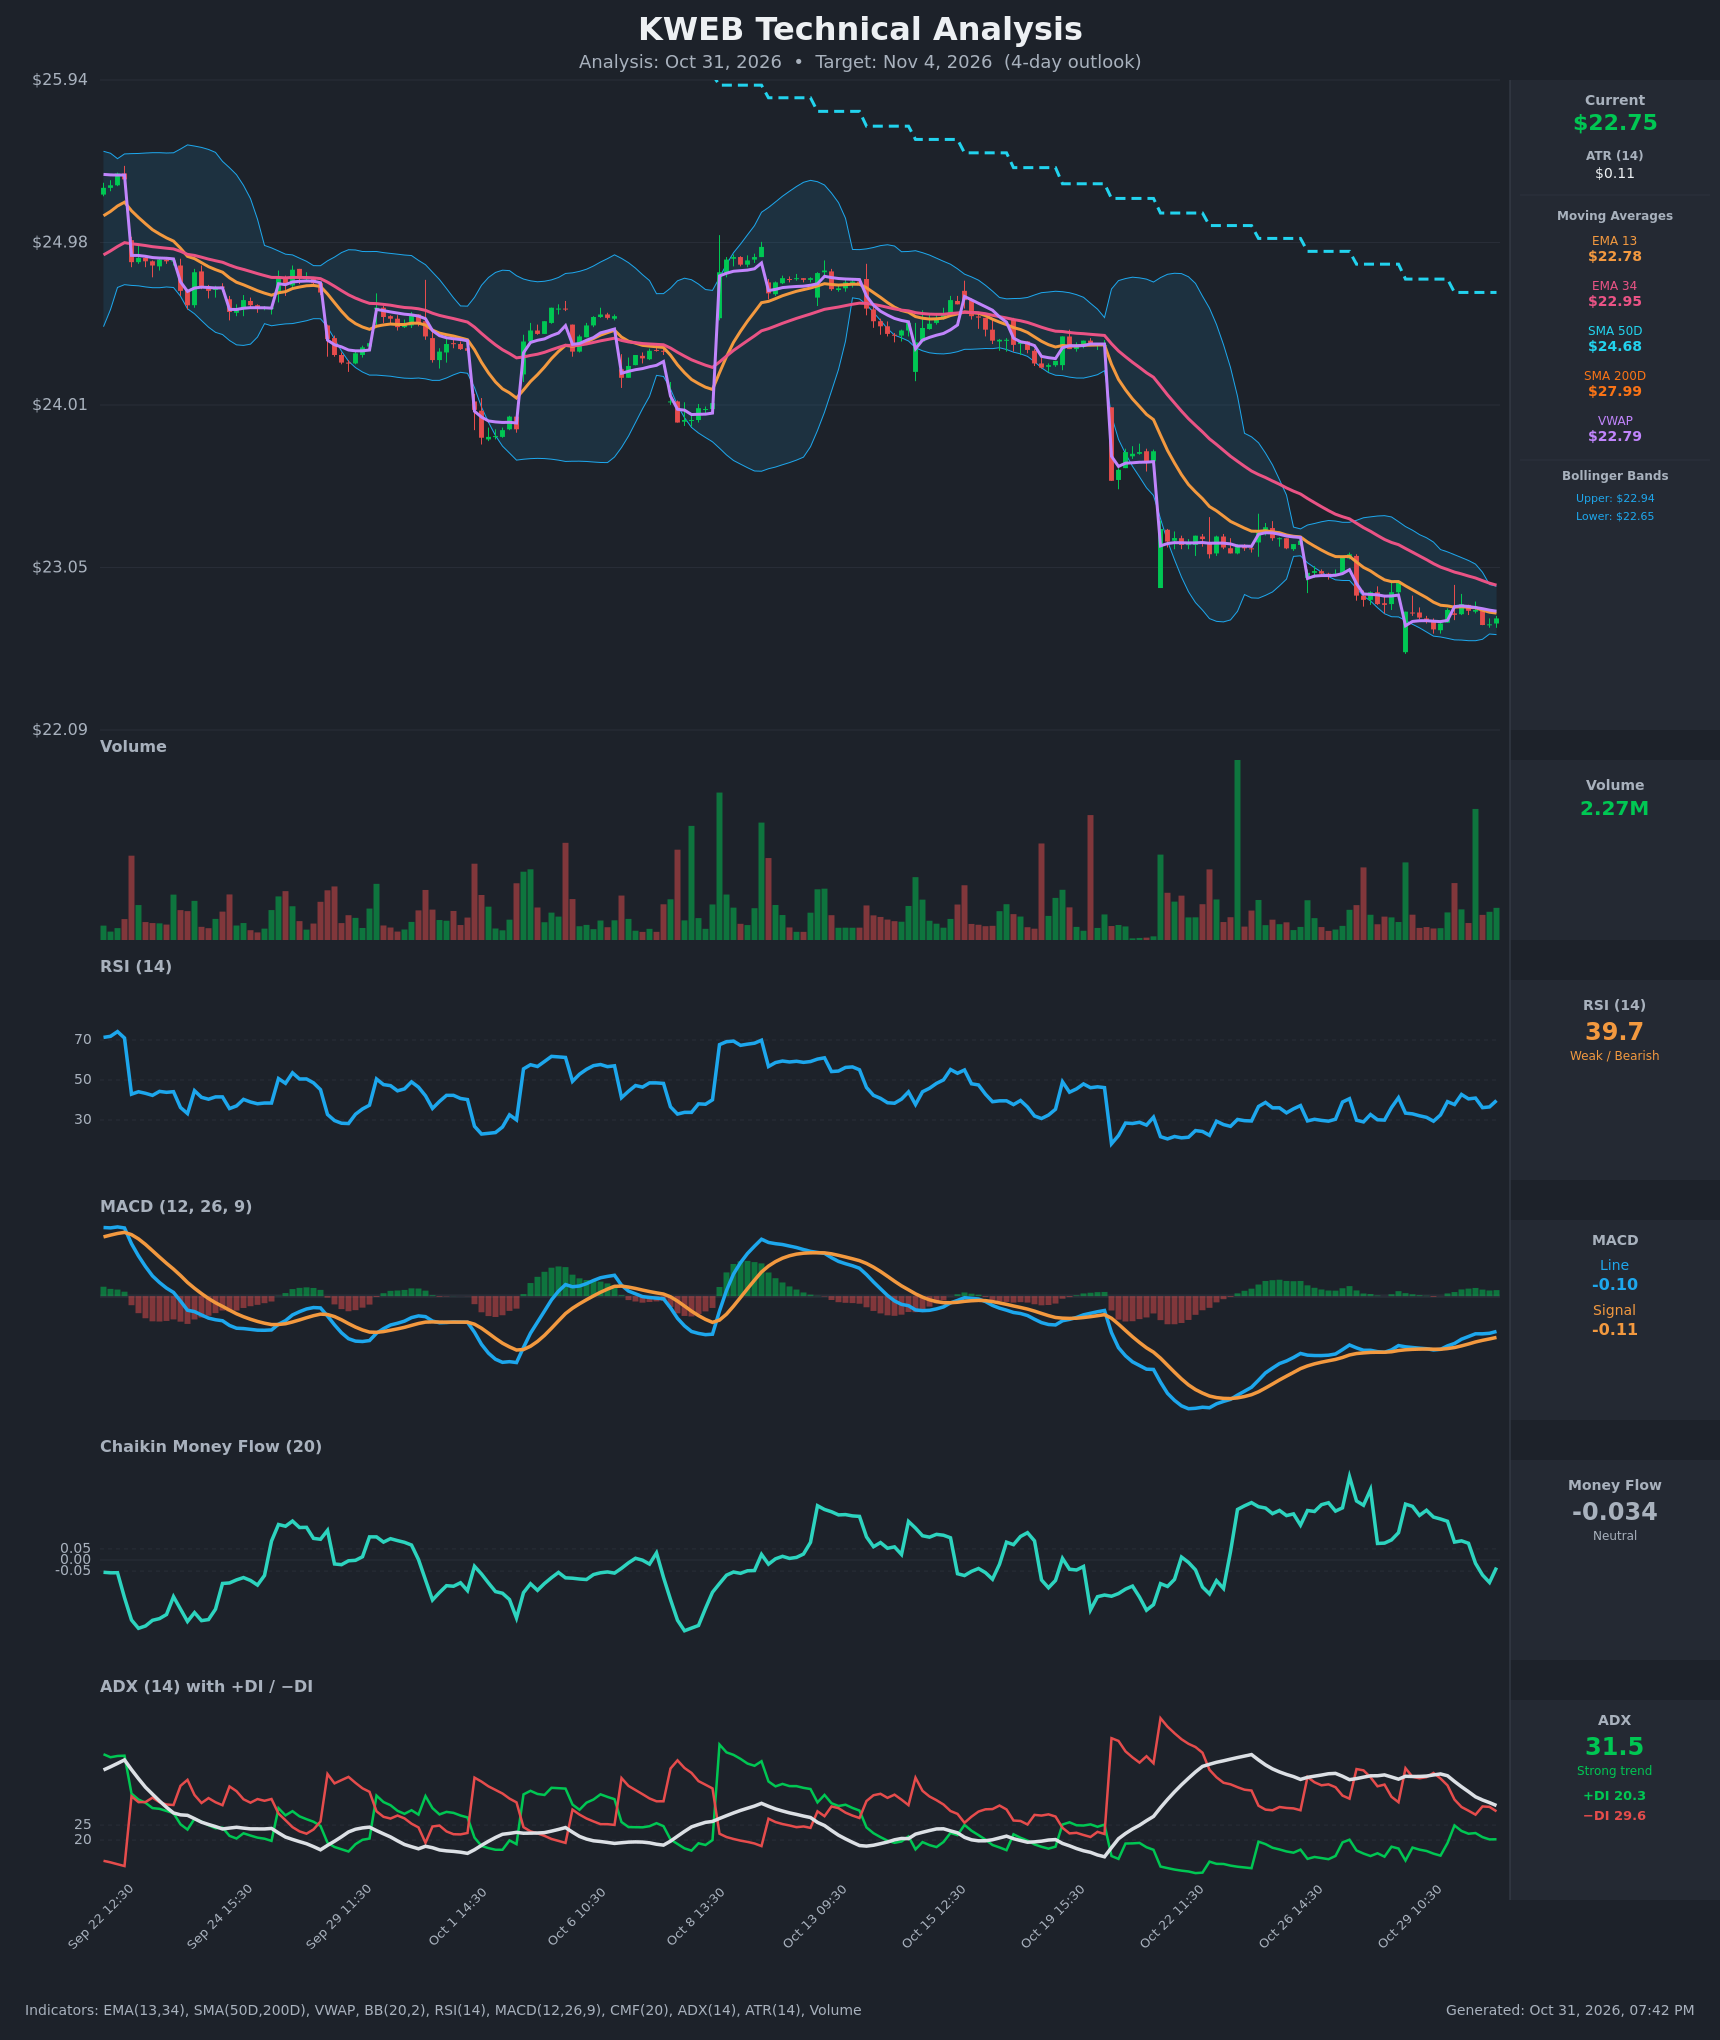
- RSI (14): 39.73, below the 50 midline but off the 29.4 oversold-edge low on Oct 29. It has been stuck between roughly 30 and 43 for about a week, which shows persistent weak momentum with no strong bounce. [Bearish]
- 20 EMA: The chart shows EMA 13 at $22.78 and EMA 34 at $22.95. Price at $22.75 sits just below EMA 13 and about $0.20 below EMA 34. EMA 13 is below EMA 34, so the bearish alignment holds, though the gap is narrowing slowly. Both averages act as overhead resistance. [Bearish]
- MACD: The line at -0.0975 is above the signal at -0.1140. A bullish crossover occurred around Oct 30 10:30, and the histogram is slightly positive. Both lines are still below zero, so this is a mild recovery within a downtrend. [Neutral]
- Bollinger Bands (20): Upper $22.94, lower $22.65, with price at $22.75 in the lower half. The bands have contracted sharply after the Oct 22 drop, a squeeze that suggests a volatility expansion is coming. Price is walking the lower band with the middle band (about $22.80) acting as resistance. [Bearish]
- CMF (20): -0.034, between -0.05 and +0.05. It has deteriorated from +0.25 on Oct 29 and is turning negative, which points to fading buying pressure. [Neutral]
- ADX (14): 31.5 and falling from 42, with -DI (29.6) above +DI (20.3). The downtrend is still strong, but it is losing intensity as the DI spread narrows. [Strong Trend – Bearish]
- Volume: 2.27M, roughly average, with a modest green uptick on the latest bars. There was no capitulation spike on the way down. The Oct 22 breakdown happened on mixed volume, so the base has not been confirmed. [Neutral]
DIVERGENCES & TRENDS
- Price made a lower low around Oct 29 while RSI (about 29-33) only retested its prior low area. MACD is higher than at the Oct 22-23 trough. This is a mild bullish momentum divergence, but it is weak.
- The long-term structure is firmly bearish. Price is below SMA50 ($24.68) and SMA200 ($27.99), and SMA50 is below SMA200, so a death cross is already in place.
- The MACD bullish crossover is small and happened below zero, so it is an unconfirmed bounce signal.
- Price is compressing sideways in a $22.65-$22.85 band after the leg down, with a tight Bollinger squeeze.
- ADX is falling from 42, which means the selling impulse is exhausting. That favors consolidation, but a bounce is not guaranteed.
- CMF has rolled over from +0.25 to -0.03, showing that the earlier accumulation is fading.
CHART PATTERNS
- After the sharp drop from about $23.60 to $23.05 and then $22.75, price has formed a tight, low-volatility range. This resembles a Bearish Pennant / Bearish Flag from the reference diagram, which is a continuation pattern.
- A break below $22.65 (the lower band and recent low around $22.50-$22.55) would project a measured move toward roughly $22.30-$22.40.
- The shallow MACD and RSI divergences leave open a Bullish Falling Wedge / base alternative, but price has not broken above the EMA 13 / VWAP cluster at $22.78-$22.80.
- Because price is below all key moving averages, the continuation pattern is favored.
POTENTIAL SCENARIOS
- Scenario 1: Bearish Continuation Lower — Price fails at the EMA 13 / VWAP / mid-band cluster near $22.80 and breaks the lower Bollinger Band as the squeeze resolves downward, in line with -DI dominance and the sub-EMA structure. Trigger: close below $22.65 with rising volume. Target: $22.40-$22.50, then $22.30. Invalidation: close above $22.95 (EMA 34 / upper band). (50% probability)
- Scenario 2: Neutral Range Grind — Price chops between $22.60 and $22.90 as ADX fades and volatility stays compressed. Trigger: no break of $22.65 or $22.95. Target: $22.70-$22.80. Invalidation: a decisive close outside the range. (25% probability)
- Scenario 3: Bullish Relief Bounce — The MACD crossover and mild divergences lead to a short-covering bounce toward EMA 34. Trigger: close above $22.95 on rising volume. Target: $23.10-$23.20. Invalidation: close back below $22.65. (25% probability)
PRICE TARGETS
- Target Price: $22.58 (4-day)
- Expected Range: $22.20 to $23.00 (width $0.80, about 3.5% of current price, consistent with 2-4 days; ATR $0.105 supports roughly $0.40 of typical 4-day movement each way)
- Key Levels: Support at $22.50, Resistance at $22.95
OVERALL BIAS
OVERALL BIAS: BEARISH - Price is below EMA 13, EMA 34, SMA50 and SMA200, -DI dominates a still-strong ADX, and RSI is stuck in the weak 30s. The Bollinger squeeze near the lower band is more likely to resolve with continuation lower. The small MACD crossover and fading CMF argue for caution, so conviction is modest.
This is educational analysis and not financial advice.