KWEB 20-day bearish forecast — Nov 15, 2026
- Bias: Bearish
- Timeframe: 20 days (made Nov 15, 2026, target date Dec 4, 2026)
- Price at analysis: $22.93
- Price target: $22.30
- Expected range: $21.10 – $23.90
- Result: Pending — graded after the close on Dec 4, 2026
Get a free AI analysis of KWEB today
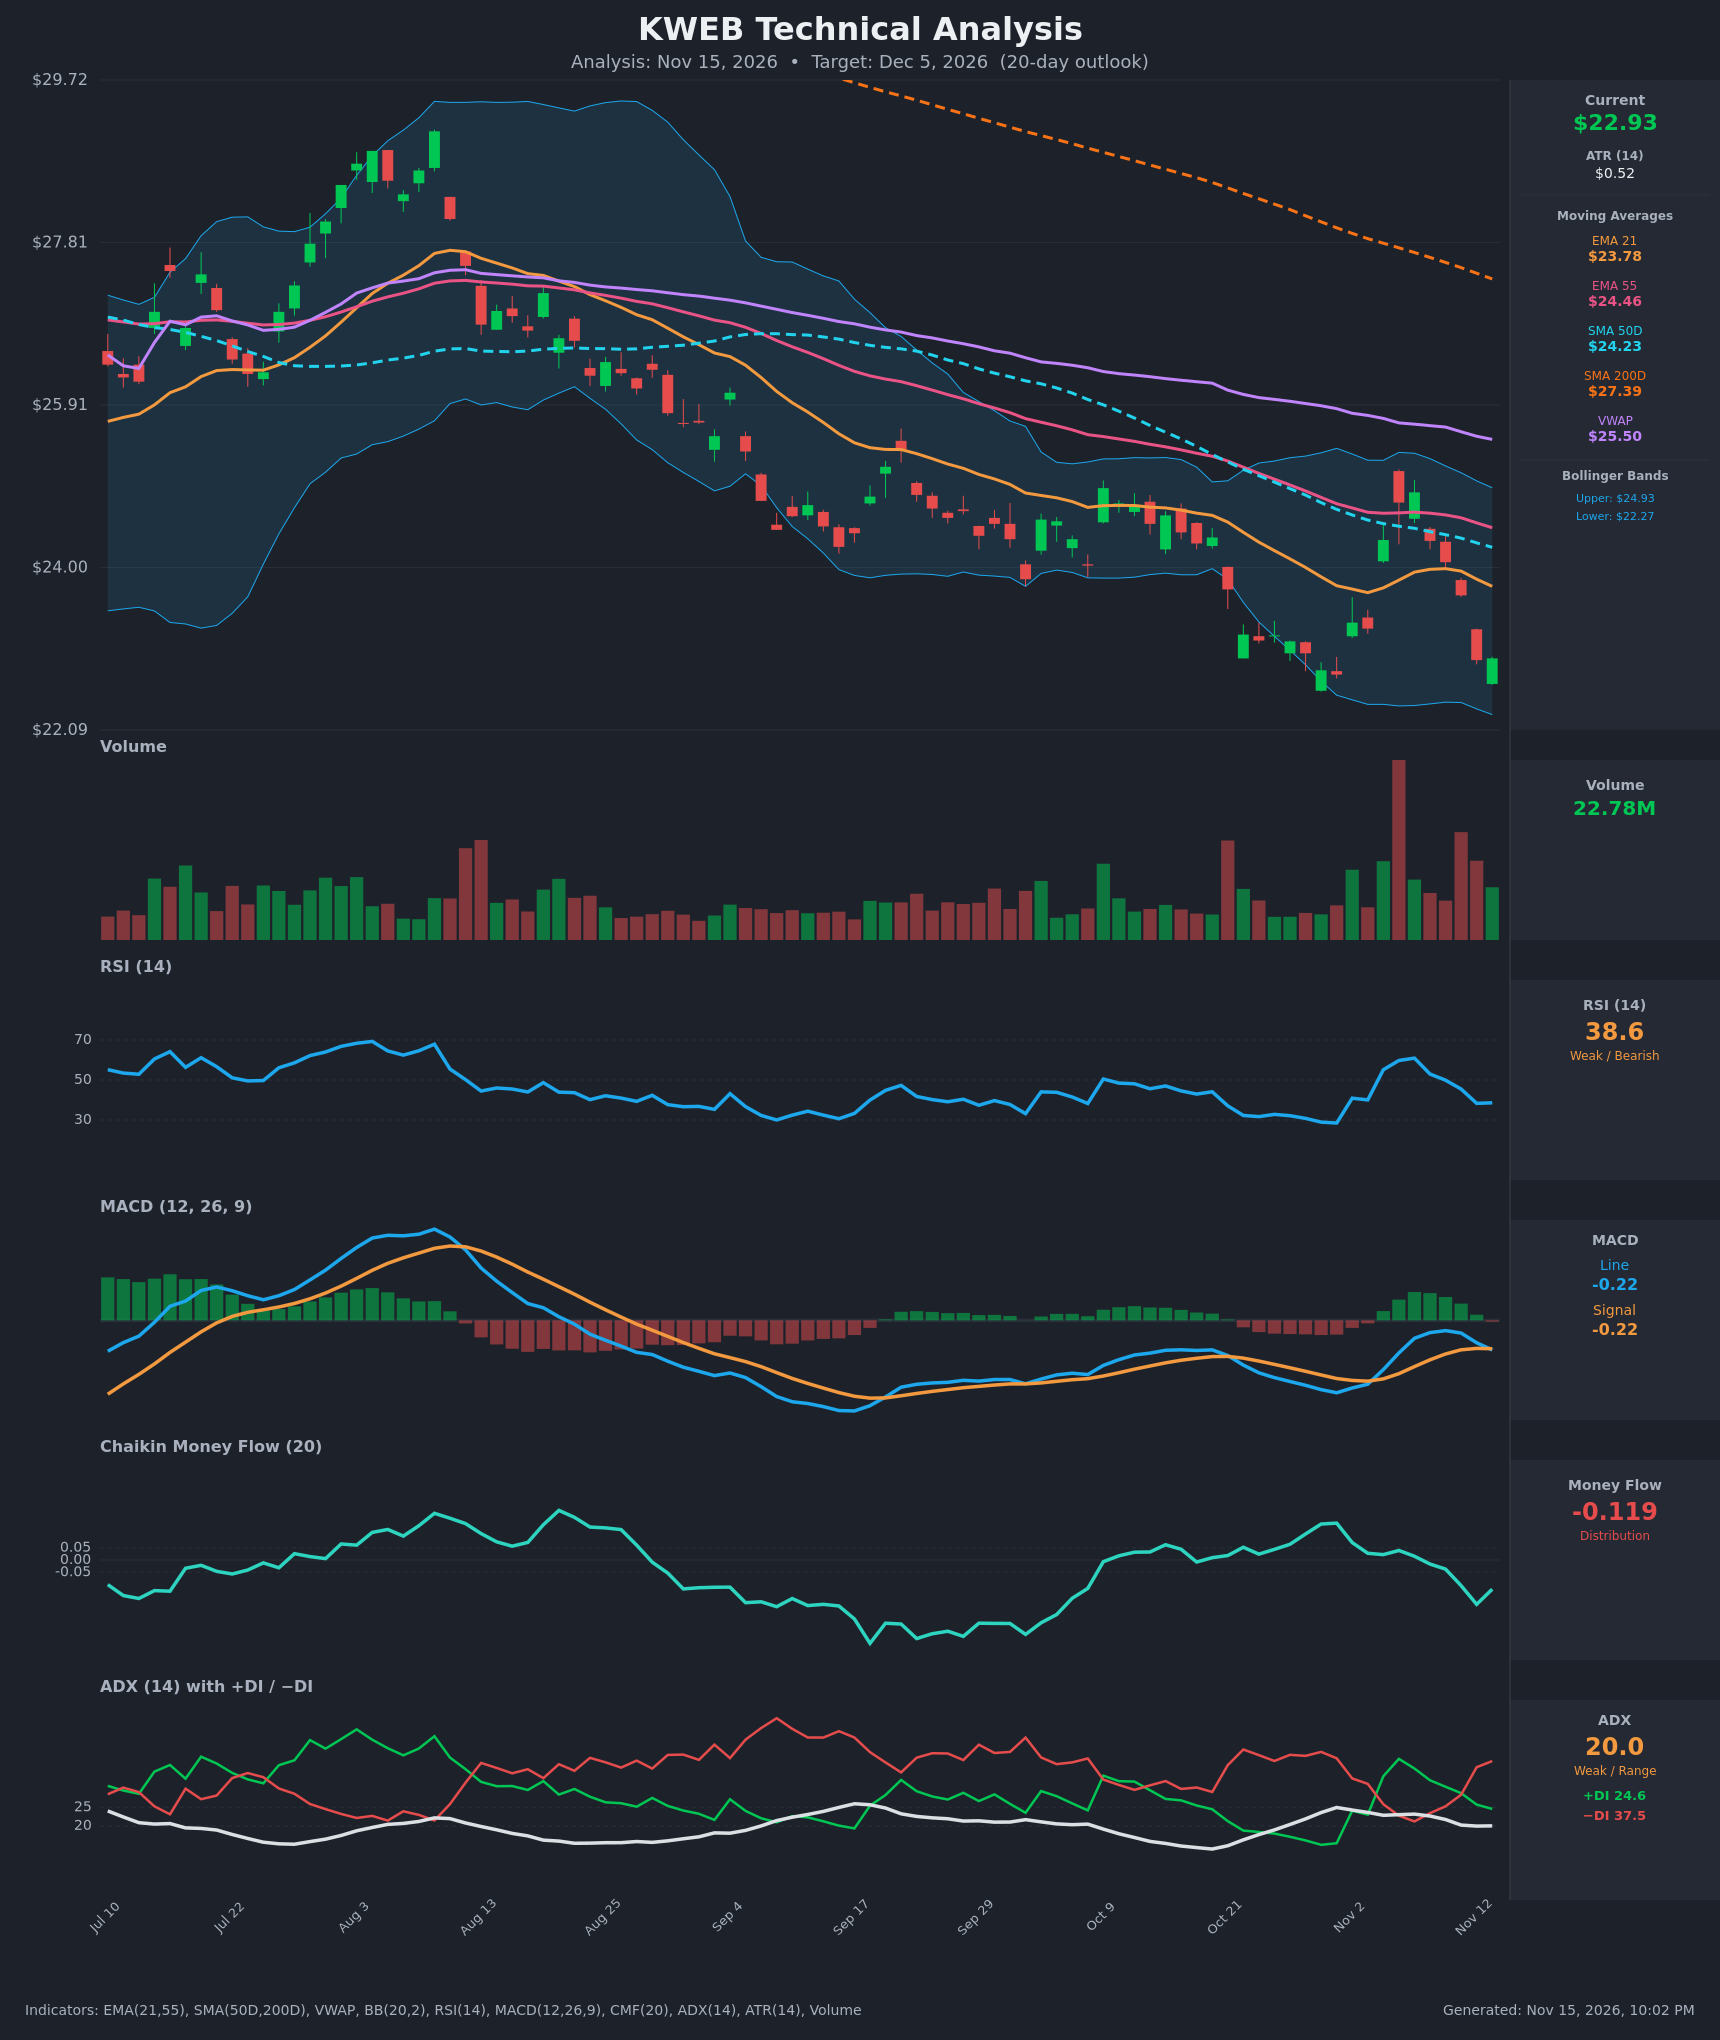
Analysis
TECHNICAL INDICATORS
- RSI (14): 38.6, rolling over from 60.9 on Nov 6 and back near the weak zone. It is not oversold (the Oct 30 low was 28.5), and momentum is falling. [Bearish]
- 20 EMA: The EMA 21 is $23.78 and price at $22.93 is below it, so it acts as resistance. EMA 21 is also below EMA 55 ($24.46), which confirms a bearish stack. [Bearish]
- MACD: The line is -0.225 and the signal is -0.215. The line has just crossed below the signal, so the histogram is slightly negative after a brief positive stretch. The bullish momentum burst from early November has faded. [Bearish]
- Bollinger Bands (20): The bands run from $22.27 to $24.93, with the midline near $23.60. Price is in the lower third of the bands, about $0.66 above the lower band. The bands are fairly wide, and the stock keeps trending along the lower half. A bounce from the lower band is possible, but price is not yet at the extreme. [Bearish]
- CMF (20): -0.119, down from +0.15 on Oct 30. It is firmly below -0.05, so selling pressure and distribution are increasing. [Distribution]
- ADX (14): 20.0 with -DI at 37.5 above +DI at 24.6. The trend is weak but the directional bias is clearly bearish. The -DI is re-widening after +DI briefly led on Nov 5-6. [Weak Trend, Bearish direction]
- Volume: 22.78M, around or slightly above average. The recent down days (red bars) have had heavy volume, including a very large spike in early November, and selling volume has recently exceeded buying volume. [Bearish, selling pressure]
DIVERGENCES & TRENDS
- Price is below every moving average: EMA21 $23.78, EMA55 $24.46, SMA50D $24.23, VWAP $25.50, SMA200D $27.39. The SMA50D is well below the SMA200D, so the death cross is already in place and the long-term trend is down.
- The Nov 4-6 bounce reached $24.88 and was rejected near the EMA 55 and SMA 50D area. The lower high is a bearish sign.
- Price made lower lows over the last few weeks while RSI is above its late-October trough (28.5 vs 38.6). This is not a divergence at the current price, because RSI is currently making a lower high from its peak of 60.9.
- The MACD bearish crossover (line below signal) has just occurred, and CMF has dropped from positive territory back to distribution. Both confirm renewed downside pressure.
- ADX is below 25 and flat, so the downtrend is orderly rather than accelerating. A break below $22.74 (the Oct 30 low) could lift ADX above 25.
CHART PATTERNS
- The broader structure is a persistent descending channel with lower highs and lower lows since the August peak near $29. This is a continuation-type bearish pattern.
- Over the last 3 weeks, price has formed a possible Bearish Flag / Pennant (a rally to $24.88 and then fading). Its breakdown below the Oct 30 low of $22.74 would target roughly $21.50-$22.00.
- The Oct 30 and Nov 12-13 lows (about $22.74 to $22.91) form a potential Double Bottom-like support zone. A hold here with a close back above $23.78 would be a short-term bullish reversal. This is not yet confirmed, because there is no neckline break and CMF is deteriorating.
- Overhead resistance (the dotted orange SMA 200D in the chart) is far above at $27.39 and falling.
POTENTIAL SCENARIOS
- Scenario 1: Bearish Breakdown Continuation — Price loses the $22.74 support (the Oct 30 low) and continues lower inside the descending channel as distribution persists. Trigger: Daily close below $22.70 with volume above average. Target: $21.80, with an extension to $21.40. Invalidation: Daily close above $23.80 (EMA 21). (50% probability)
- Scenario 2: Neutral Range Bounce — Price holds the $22.30-$22.74 support zone near the lower Bollinger Band and chops between $22.30 and $23.80. Trigger: Hold of the $22.70 area with RSI stabilizing near 35-40. Target: $23.20 within the range. Invalidation: Close below $22.20 or above $24.00. (28% probability)
- Scenario 3: Bullish Relief Rally — An oversold bounce off the lower band retests the EMA 55 and SMA 50D zone. Trigger: Close above $23.80 with MACD recrossing above signal and CMF turning up. Target: $24.40-$24.90. Invalidation: Rejection at $24.20 followed by a close below $22.70. (22% probability)
PRICE TARGETS
For the 20-day timeframe (ending Dec 5, 2026), the range width should be about 8-12% of the current price (the 14-21 day guidance). Using a range of $21.10 to $23.90 gives a $2.80 width, or about 12.2% of $22.93, which sits at the top of that band and is acceptable given the ATR of $0.52 (about 3.5 average daily-range multiples over 20 days).
- Target Price: $22.30 (for the 20-day timeframe)
- Expected Range: $21.10 to $23.90
- Key Levels: Support at $22.27 (lower Bollinger Band; the $21.80 area is next), Resistance at $23.78 (EMA 21; the $24.46 EMA 55 is next)
OVERALL BIAS
OVERALL BIAS: BEARISH - Price is below all key moving averages with a death cross in place, -DI dominating +DI, a fresh MACD bearish crossover, and CMF back in distribution. The weak ADX and lower-band proximity limit the downside magnitude, so a modest drift lower toward $22.30 is expected.
This is educational analysis and not financial advice.