KWEB 34-day bearish forecast — Nov 15, 2026
- Bias: Bearish
- Timeframe: 34 days (made Nov 15, 2026, target date Dec 18, 2026)
- Price at analysis: $22.93
- Price target: $22.20
- Expected range: $20.60 – $24.40
- Result: Pending — graded after the close on Dec 18, 2026
Get a free AI analysis of KWEB today
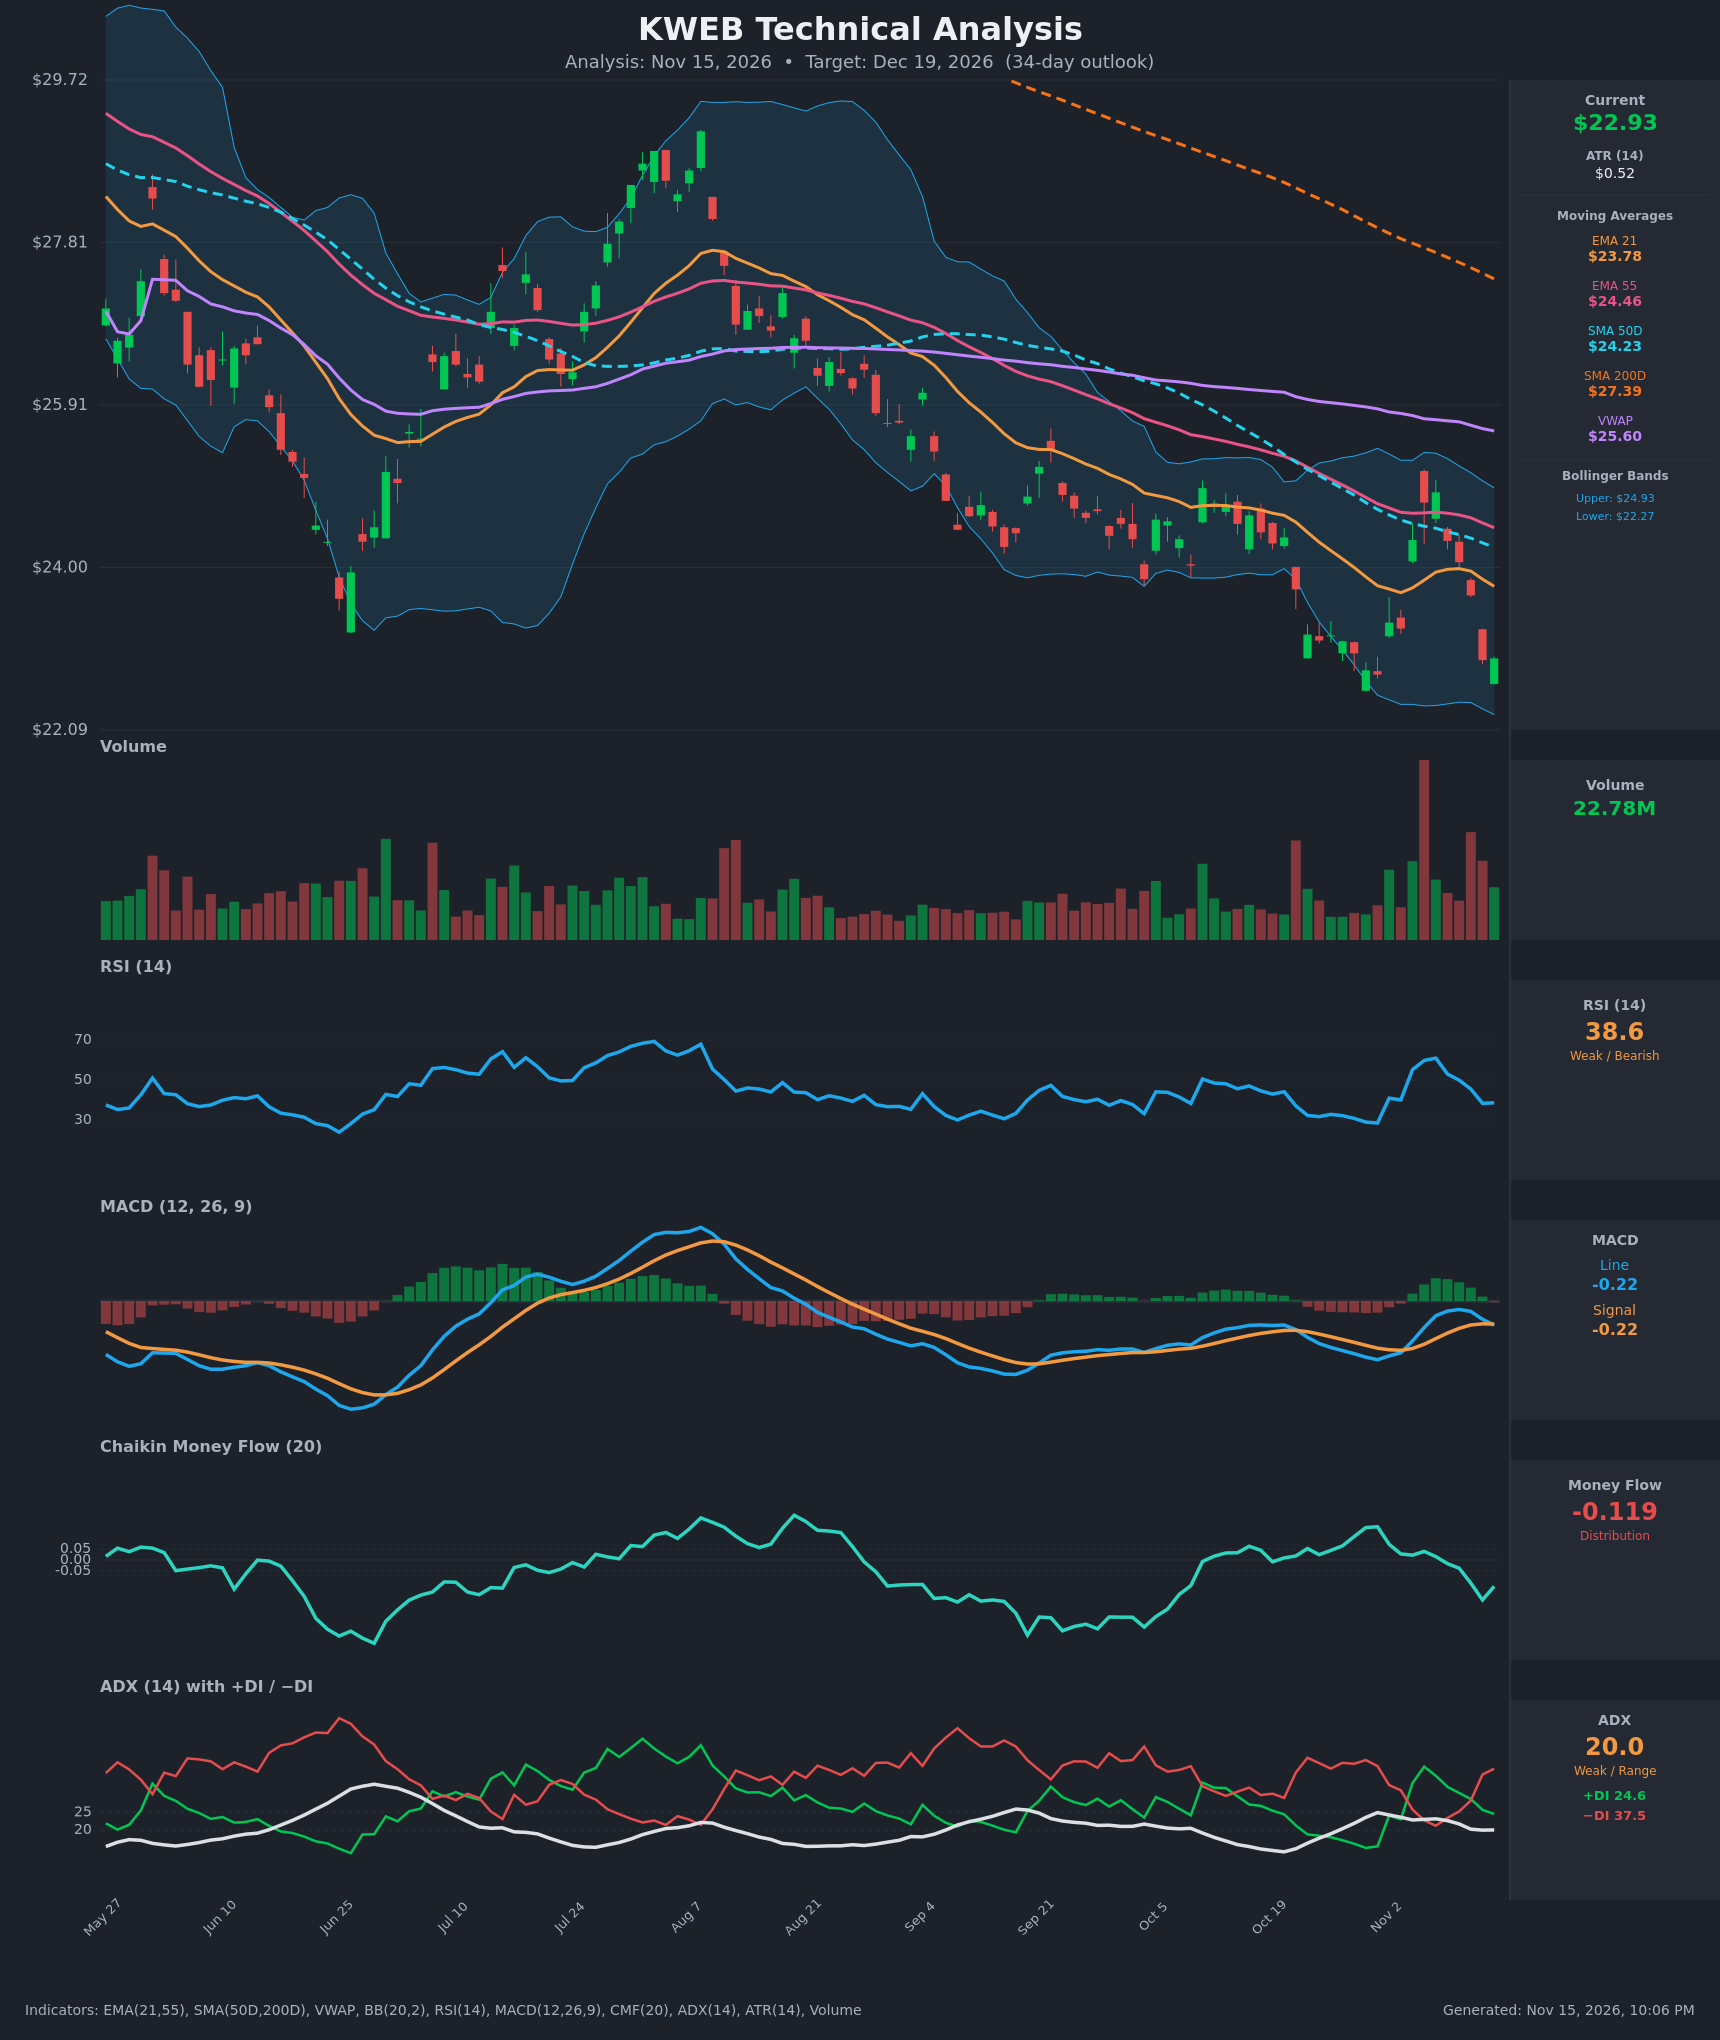
Analysis
TECHNICAL INDICATORS
- RSI (14): 38.6, down from 60.9 on Nov 6 and back near the 30–40 zone. It is not oversold, but momentum has clearly rolled over after the failed bounce. [Bearish]
- 20 EMA (21 EMA): $23.78, with price at $22.93 below it. EMA21 is also below EMA55 ($24.46), so the EMA stack is bearish and the 21 EMA acts as resistance. [Bearish]
- MACD: Line -0.225 has just crossed below the signal at -0.215, a fresh bearish crossover below zero. The histogram has flipped slightly negative after a brief positive stretch. [Bearish]
- Bollinger Bands (20): Upper $24.93, lower $22.27. Price at $22.93 sits in the lower third of the bands, about $0.66 above the lower band. The bands are wide after the volatile bounce and drop, and there is no squeeze. Price is not yet at the lower band, so there is room for another leg down. [Bearish]
- CMF (20): -0.119, below the -0.05 threshold and falling from +0.15 on Oct 30. Distribution is increasing. [Distribution]
- ADX (14): 20.0 with -DI (37.5) well above +DI (24.6). The trend is weak but bears control direction. -DI has re-widened its lead after the Nov 6 bounce failed. [Weak Trend, Bearish Direction]
- Volume: 22.78M on the latest bar, which is elevated. Recent heavy red bars, including the huge spike around Nov 4 and big down days on Nov 11–12, show active selling. The latest green candle is a small bounce. The pattern is distribution-heavy. [Bearish interpretation]
DIVERGENCES & TRENDS
- Price is making lower lows (about $22.7 on Oct 30, then $22.91 on Nov 12 and $22.93 now). RSI made a higher low, 38.3 vs 28.5, a mild bullish divergence. It is not confirmed, because MACD and CMF rolled over rather than turned up.
- Price remains below SMA200D ($27.39), which is falling. SMA50D ($24.23) is below SMA200D, so the death cross is already in effect and the long-term trend is down.
- SMA50D and EMA55 are acting as overhead resistance. The Nov 6 rally topped just above both, near $24.88, and was rejected.
- The MACD bearish crossover on Nov 13 and CMF dropping back into distribution show that the early-November rally has been fully retraced.
- The ADX-reading of 20 shows the downtrend is not strongly accelerating. It is a grinding decline, so the chance of a range-bound bounce is real.
CHART PATTERNS
- Bearish Flag / Rising Wedge-like rebound: The Oct 30 low to Nov 6 high bounce into declining resistance, then rejection, resembles a failed counter-trend rally within a larger downtrend. This is a continuation signal.
- Possible Triple/Double Bottom base: Lows near $22.7–22.9 (Oct 30, Nov 12–13) form a potential double-bottom. A confirmed breakout requires a close above the neckline at roughly $24.9 (Nov 6 high), which is a long way off. Without that, the pattern is unconfirmed.
- Measured target: A break below $22.70 would project toward $21.50–$22.00 based on the prior bounce height (about $2.1) and ATR extension. A double-bottom success would aim for $26, but the evidence does not favor that.
POTENTIAL SCENARIOS
- Scenario 1: Bearish Support Break and Continuation — The double-bottom support at $22.70 fails, with the downtrend resuming under bearish MACD, -DI dominance, and distribution. Trigger: Daily close below $22.70 on above-average volume. Target: $21.60–$22.00. Invalidation: Close above $23.80 (EMA21). (50% probability)
- Scenario 2: Neutral Base Building — Price holds the $22.3–$22.9 floor and chops back toward $23.5–$24.0 as RSI divergence plays out, with ADX staying near 20. Trigger: Hold above $22.70 with RSI above 40. Target: $23.30–$23.90. Invalidation: Close below $22.50. (30% probability)
- Scenario 3: Bullish Double-Bottom Reversal — A sharp recovery through the EMA21 and EMA55 and a retest of the Nov 6 high. Trigger: Close above $24.00 with CMF turning positive. Target: $24.90–$25.50. Invalidation: Failure at $24.20 or a close below $22.70. (20% probability)
PRICE TARGETS
- Target Price: $22.20 (34-day)
- Expected Range: $20.60 to $24.40 (width $3.80 ≈ 16.6% of current price, consistent with the 12–18% guidance for 30–60 days)
- Key Levels: Support at $22.27 (lower Bollinger Band, near the $22.70 base), Resistance at $23.78 (EMA21)
OVERALL BIAS
OVERALL BIAS: BEARISH - Price is below all key moving averages, the death cross is in place, MACD has crossed bearishly, CMF shows distribution, and -DI dominates. The mild RSI divergence is the only bullish counterpoint, and the expected downside is modest because ADX is low.
This is educational analysis and not financial advice.