KWEB 62-day bearish forecast — Nov 15, 2026
- Bias: Bearish
- Timeframe: 62 days (made Nov 15, 2026, target date Jan 15, 2027)
- Price at analysis: $22.93
- Price target: $21.20
- Expected range: $18.50 – $24.50
- Result: Pending — graded after the close on Jan 15, 2027
Get a free AI analysis of KWEB today
Analysis
TECHNICAL INDICATORS
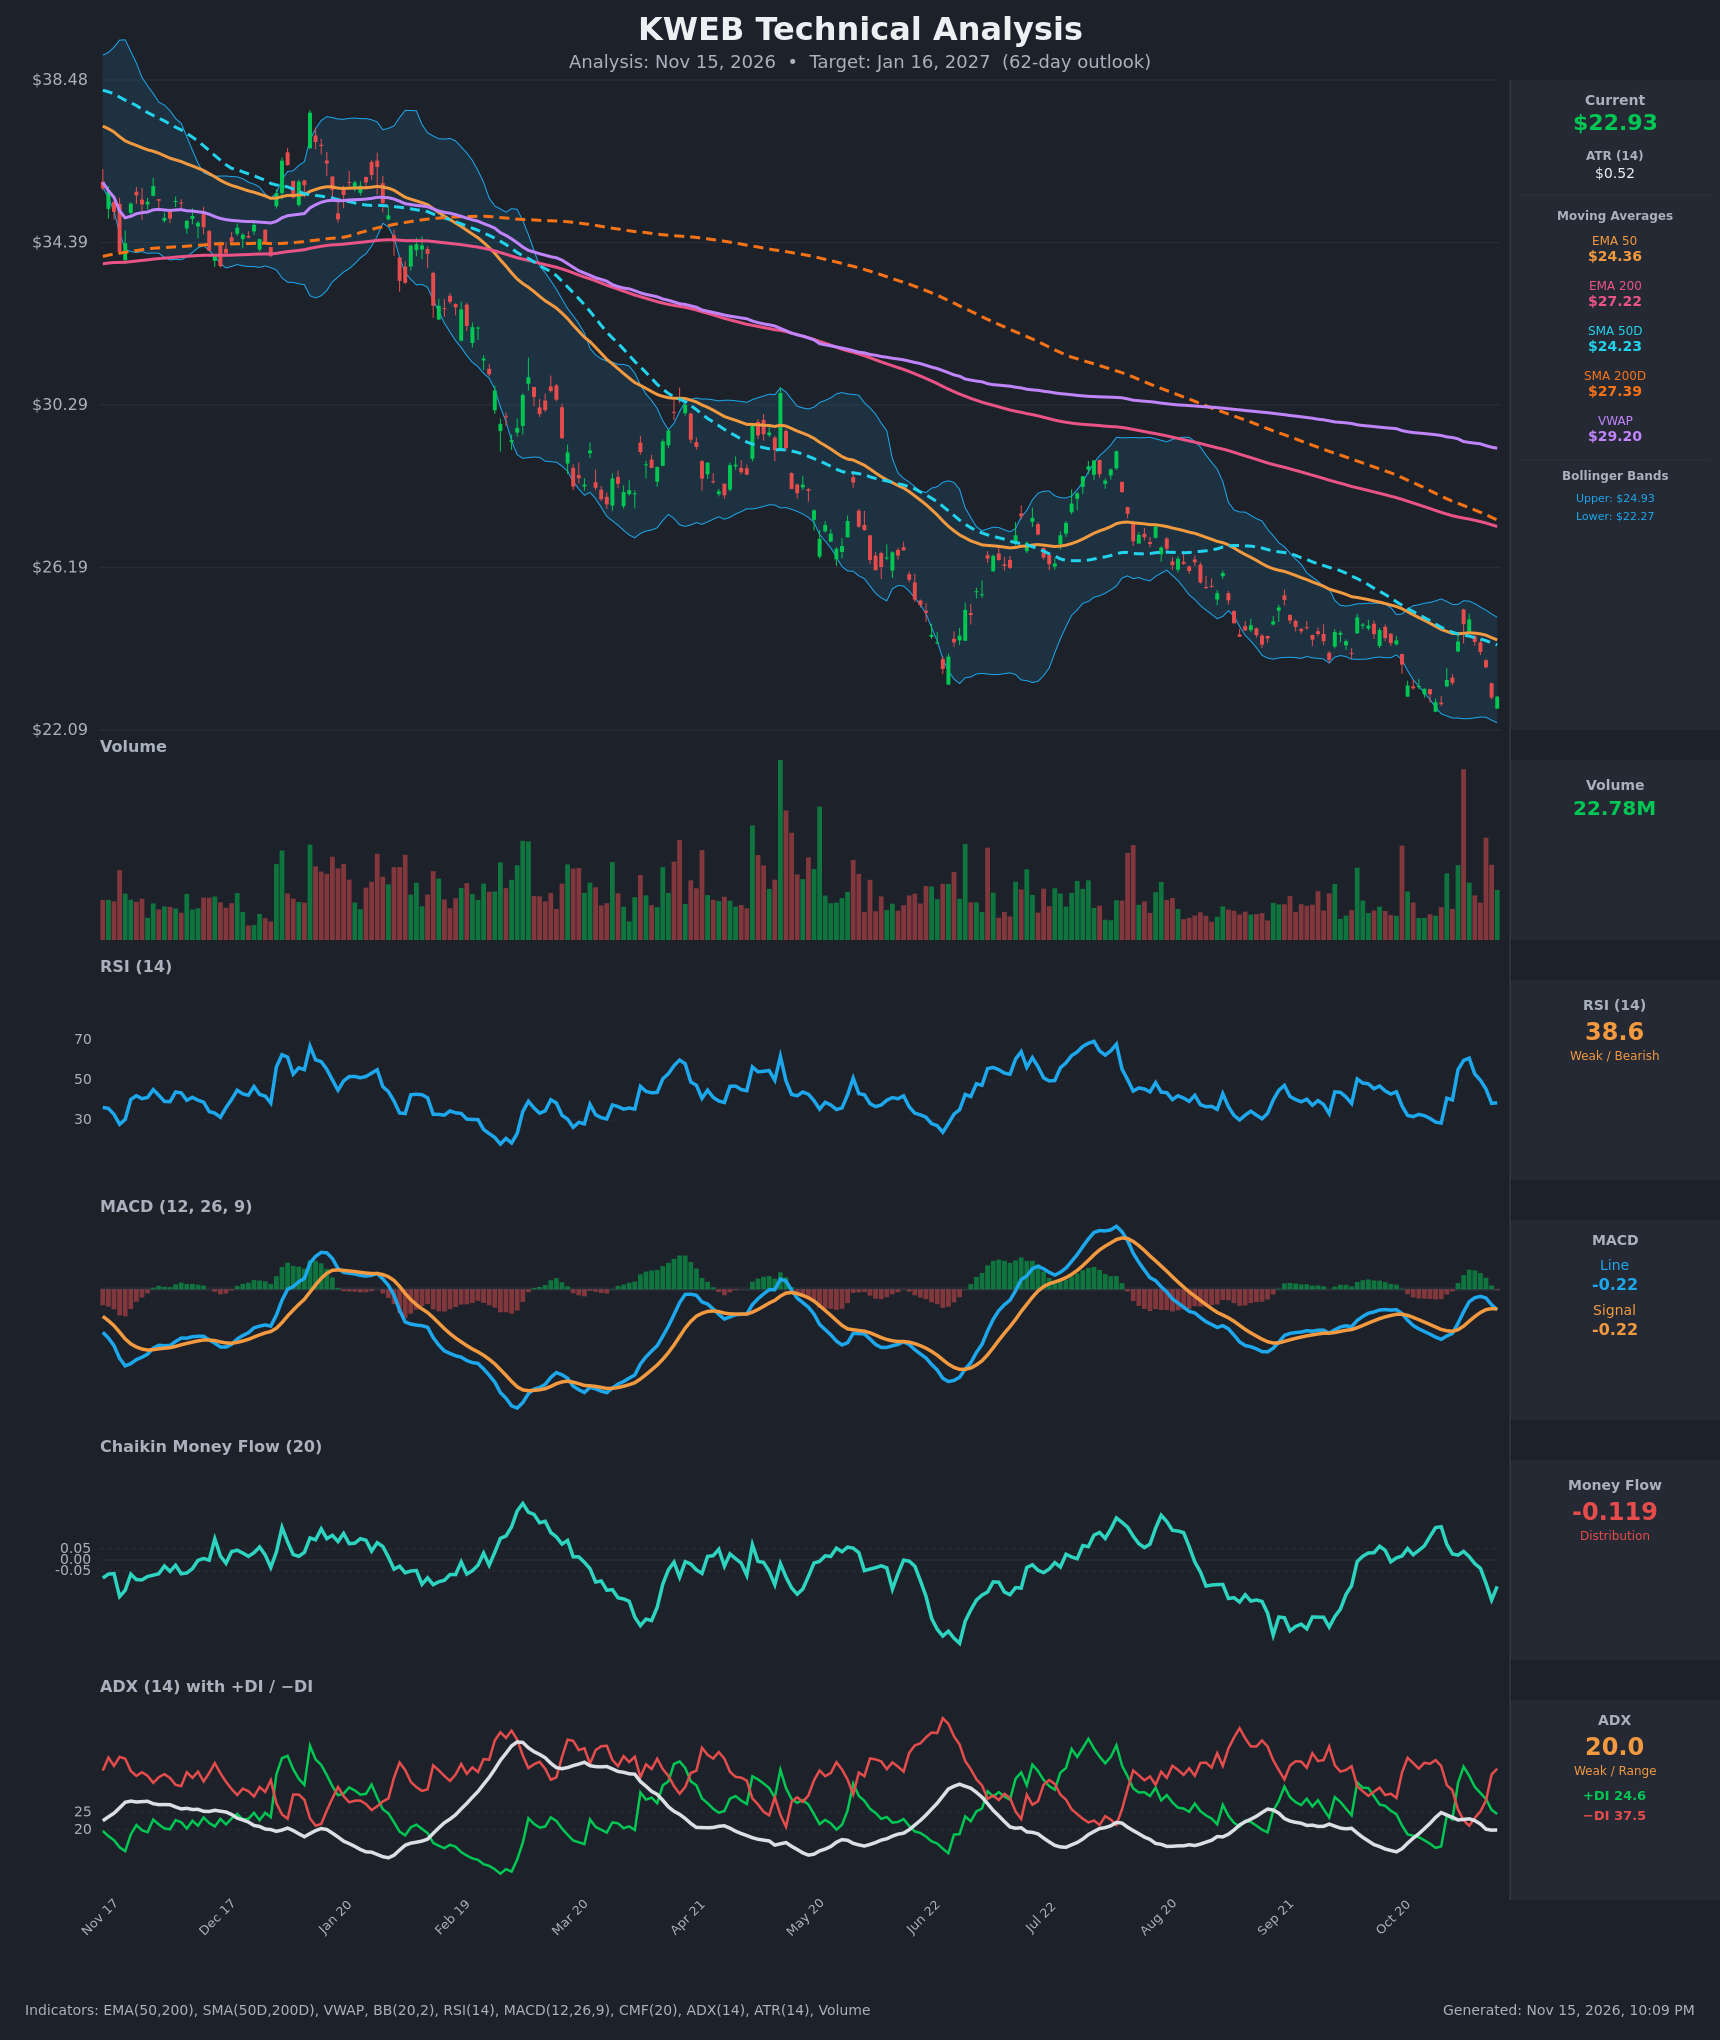
- RSI (14): 38.60, below the 50 midline and just off the Nov 12 low of 38.3. It bounced from 28.5 to a 60.9 peak on Nov 6, then rolled over. It is not oversold, so there is room to fall further. [Bearish]
- 20 EMA: The 20 EMA is not given. Price at $22.93 sits below the EMA50 ($24.36), which is a reasonable proxy for the mid-term average and is falling. Price is also below the SMA50D ($24.23). The bounce to $24.88 failed right at these averages. [Bearish]
- MACD: Line -0.225 is just below signal -0.215, so it has turned into a fresh bearish crossover. Both sit below zero and the histogram is slightly negative. The late-October low was higher than the lows before it, but the Nov 6 peak was a lower high. [Bearish]
- Bollinger Bands (20): Upper $24.93, lower $22.27. Price at $22.93 is in the lower quarter of the band, roughly 25% of the way up. The bands are narrow relative to the earlier trend, suggesting contracted volatility. The chart shows price riding the lower band, which is typical of a persistent downtrend. [Bearish]
- CMF (20): -0.119, well below -0.05 and dropping from positive readings in early November (+0.15 on Oct 30). The rally's buying pressure faded and distribution is back. [Distribution]
- ADX (14): 20.0 with -DI 37.5 over +DI 24.6. Trend strength is borderline and weak, but the bears are clearly in control. The Nov 4-6 +DI crossover was short-lived and -DI retook the lead on Nov 11-12. [Weak Trend, Bearish Direction]
- Volume: 22.78M. There were large spikes on both the late-October selloff and the bounce, but recent volume is not showing strong accumulation. Heavy-volume red bars near the lows suggest active selling. Volume has not confirmed any reversal. [Bearish/Neutral - no capitulation volume]
DIVERGENCES & TRENDS
- Long-term trend: Price is below every major average. SMA200D ($27.39) is above SMA50D ($24.23), a death cross already in place. EMA200 ($27.22) is above EMA50 ($24.36) and both are sloping down. VWAP at $29.20 is far above price, a persistent overhead supply zone.
- Price vs RSI: Price is making new lows near $22.9, but the RSI low (38) is higher than the late-October low (28.5). This is a minor bullish divergence only on the short-term swing, and the failure at 60 RSI limits its reliability.
- MACD: The bullish MACD crossover of Nov 4-5 has reversed into a bearish cross. The momentum recovery failed and the line is turning down again.
- Money flow: CMF has dropped from +0.15 to -0.12 in two weeks, confirming that the bounce was sold.
- Trend structure: Since January the chart shows lower highs and lower lows, with each rally failing at the 50-period averages. The July rally peaked at the declining EMA50 and SMA50D, and the November rally did the same.
- ADX: The ADX is low (20) even after a persistent decline, so this is a grinding drift rather than a panicked collapse. The -DI dominance is the key signal.
CHART PATTERNS
- Primary pattern: The multi-month series of lower highs and lower lows with repeated rebounds into the falling averages resembles a Bearish Flag/Descending channel continuation, and the swings since June have the shape of a Bearish Rising Wedge attempt that broke down. The measured move suggests further downside.
- Descending Triangle-like behavior: The June low near $23.3 held and then was broken in November, with the current price around $22.93. That confirms a breakdown of horizontal support and supports a continuation lower.
- Targets: With ATR at $0.52, a measured move from the failed $24.9 bounce to the $22.3-22.9 breakdown zone projects roughly $2 lower, to about $20.5-21.0.
- Counterpoint: A Bullish Falling Wedge or Double Bottom reversal would require a break above $24.9-25.0 (upper band, EMA50 and SMA50D) and has not formed.
POTENTIAL SCENARIOS
- Scenario 1: Bearish Continuation Lower — Price stays below the falling EMA50/SMA50D, -DI stays dominant and CMF remains negative, extending the downtrend. Trigger: Daily close below the lower Bollinger Band at $22.27. Target: $20.50-$21.00. Invalidation: Daily close above $24.40 (EMA50). (55% probability)
- Scenario 2: Neutral Range Basing — The stock stabilizes around the lows and chops between the lower band and the 50-day averages as ADX stays near 20. Trigger: Holds $22.00-$22.30 on a retest with fading volume. Target: $22.00-$24.50 range. Invalidation: Close below $22.00 or above $25.00. (25% probability)
- Scenario 3: Bullish Relief Rally — Oversold bounce supported by the minor RSI divergence pushes price back toward the declining averages. Trigger: Close above $24.93 with CMF turning positive. Target: $26.00-$27.20 (EMA200 area). Invalidation: Close back below $22.30. (20% probability)
PRICE TARGETS
- Target Price: $21.20 (62-day, to Jan 16, 2027)
- Expected Range: $18.50 to $24.50 (width $6.00 = ~26% of current price, in line with the 18-30% guidance for 61-180 days)
- Key Levels: Support at $22.27 (lower Bollinger Band), Resistance at $24.36 (EMA50)
OVERALL BIAS
OVERALL BIAS: BEARISH - Price sits below all major moving averages with a death cross in place, -DI dominates, CMF shows distribution, and the MACD has turned back down after a failed rally. The 62-day target of $21.20 is below the current price, with a short-term RSI divergence the main risk to the downside call.
This is educational analysis and not financial advice.