KWEB 83-day bearish forecast — Nov 15, 2026
- Bias: Bearish
- Timeframe: 83 days (made Nov 15, 2026, target date Feb 5, 2027)
- Price at analysis: $22.93
- Price target: $21.60
- Expected range: $19.40 – $25.00
- Result: Pending — graded after the close on Feb 5, 2027
Get a free AI analysis of KWEB today
Analysis
TECHNICAL INDICATORS
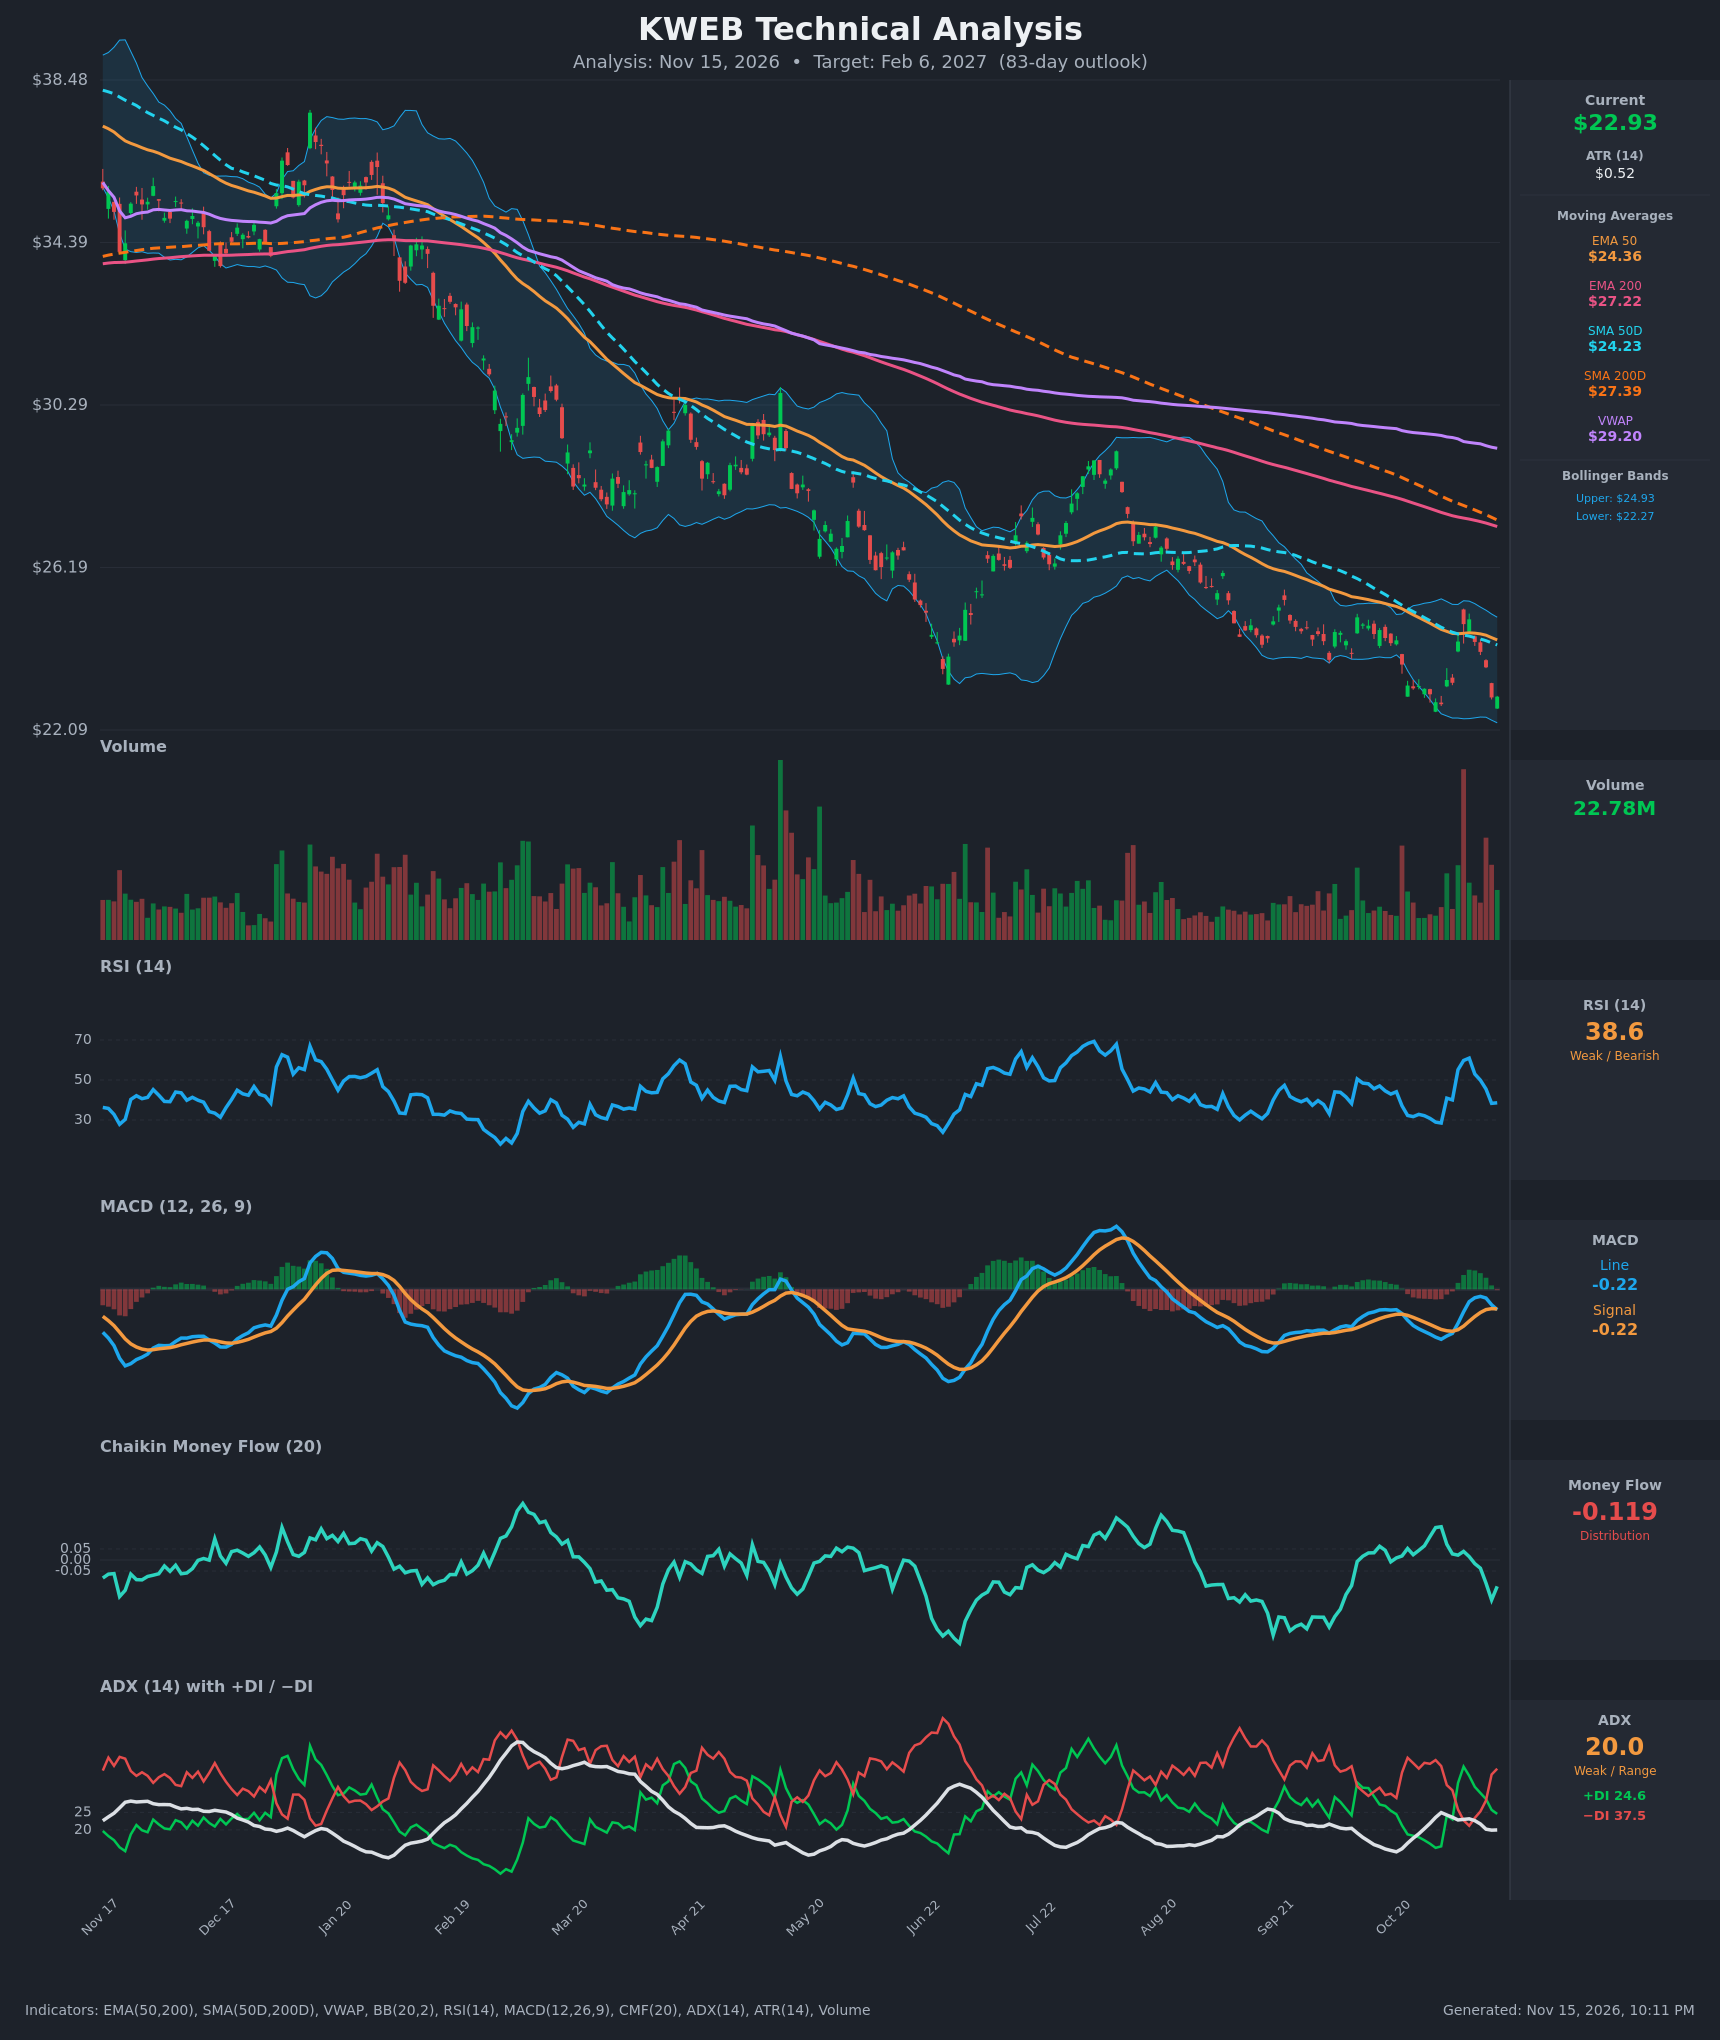
- RSI (14): 38.60. It rolled over from about 61 on Nov 6 and is now back near the weak zone. It is not yet oversold (<30), and it has made lower highs in the recent bounce. [Bearish]
- 20 EMA: Not provided. The EMA 50 at $24.36 is the nearest dynamic average. Price at $22.93 is about 6% below it, and the EMA 50 is still falling (from $24.93 on Oct 26). It acts as overhead resistance. [Bearish]
- MACD: Line -0.2248 vs. signal -0.2153. The line crossed back below the signal on Nov 13, after the Nov 4-6 bullish cross. The histogram is slightly negative, and both lines are below zero. [Bearish]
- Bollinger Bands (20): Upper $24.93, lower $22.27. Price is in the lower quarter of the band, about $0.66 above the lower band, and the bands are relatively narrow. The failed bounce reached only the upper band area (~$24.9) before reversing, and the recent trend is a "walk" along the lower half. [Bearish]
- CMF (20): -0.119. It slid from +0.15 on Oct 30 to below -0.05, which means distribution and renewed selling pressure. [Distribution]
- ADX (14): 20.0 with +DI 24.6 and −DI 37.5. The trend is borderline weak (ADX is only just at 20), but −DI is clearly on top and has widened again after the Nov 4-6 bullish DI flip failed. [Weak Trend, Bearish Direction]
- Volume: 22.78M, around or slightly above the recent average. There were heavy-volume spikes on down days in late Oct/early Nov, and the latest red candle shows follow-through selling. [Bearish interpretation: selling on volume]
DIVERGENCES & TRENDS
- Trend structure: KWEB is in a persistent multi-month downtrend with lower highs and lower lows. Price is below the EMA 50 ($24.36), SMA 50D ($24.23), EMA 200 ($27.22), SMA 200D ($27.39) and VWAP ($29.20).
- Moving average alignment: SMA 50D is below SMA 200D (death cross already in place), and the gap is still widening. EMA 50 is also below EMA 200. Everything is aligned bearishly.
- Divergence: There is a mild, unconfirmed bullish divergence on RSI. Its Oct 30 low (~28.5) was comparable to the June low even though price is now lower. However, MACD and CMF are rolling over, so it is not enough to call a reversal.
- Failed breakout: The Nov 4-6 bounce (+DI over −DI, RSI up to 61) failed at the EMA 50 and SMA 50D area (~$24.5-24.9). This is a classic bear-market rally failure. Both the MACD and DI crossovers have flipped back to bearish.
- Break of support: Price is revisiting and slightly breaking the June swing low area. It is trading at or near the lowest level on the chart (~$22.09 axis floor).
CHART PATTERNS
- Descending channel / Bearish Flag-like continuation: The Oct-Nov rebound looks like a corrective bounce inside a larger downtrend. This resembles a Bearish Flag/Pennant continuation from the reference diagram, with the failure at ~$24.9 as the rejection point.
- Descending Triangle (loose): The June lows (~$23) acted as a horizontal support zone with lower highs above it. A decisive close below ~$22.3 would resolve this to the downside.
- Measured targets: The prior leg down suggests a downside extension. A conservative 83-day target is about $21.60, with an extended target near $20 if support at ~$22.27 fails cleanly.
- Bullish Falling Wedge risk: The narrowing lower-high/lower-low structure could also be read as a falling wedge, which would resolve upward. This is not confirmed, because there has been no breakout above the EMA 50.
POTENTIAL SCENARIOS
- Scenario 1: Bearish Trend Continuation — Price rejects the EMA 50/SMA 50D zone, loses the lower Bollinger Band and the $22.09-22.27 support, and drifts lower in the descending channel. Trigger: daily close below $22.27 on above-average volume, with MACD staying negative and −DI above 35. Target: $21.60 (base case), with an extension to $20.00. Invalidation: daily close above $24.93 (upper BB and failed-rally high). (52% probability)
- Scenario 2: Neutral Basing / Range — Price stabilizes after the oversold-ish push and chops between support at ~$22.3 and resistance at ~$24.4 as ADX stays weak around 20. Trigger: RSI holding above 30 and CMF recovering toward zero. Target: $22.50-$24.00. Invalidation: close beyond either $22.00 or $24.93. (22% probability)
- Scenario 3: Bullish Reversal Bounce — The mild RSI divergence and the falling-wedge-like compression produce a relief rally that retakes the EMA 50. Trigger: close above $24.93 with CMF turning positive and a MACD bullish cross. Target: $26.20-$27.20 (the EMA 200 area). Invalidation: close below $22.09. (26% probability)
PRICE TARGETS
Timeframe: 83 days (target date Feb 6, 2027). The range width is $5.60, or about 24.4% of the current price, which is within the 18-30% guideline for 61-180 days.
- Target Price: $21.60 (83-day target)
- Expected Range: $19.40 to $25.00
- Key Levels: Support at $22.27 (lower Bollinger Band), Resistance at $24.36 (EMA 50)
OVERALL BIAS
OVERALL BIAS: BEARISH - Price is below every major moving average and VWAP, −DI dominates +DI, CMF shows distribution, and MACD has re-crossed bearishly after a failed rally at the EMA 50/SMA 50D. A mild RSI divergence and weak ADX limit conviction, but the weight of evidence favors lower prices.
This is educational analysis and not financial advice.