KWEB 48-day bearish forecast — Nov 15, 2026
- Bias: Bearish
- Timeframe: 48 days (made Nov 15, 2026, target date Jan 1, 2027)
- Price at analysis: $22.93
- Price target: $21.60
- Expected range: $19.40 – $24.40
- Result: Pending — graded after the close on Jan 1, 2027
Get a free AI analysis of KWEB today
Analysis
TECHNICAL INDICATORS
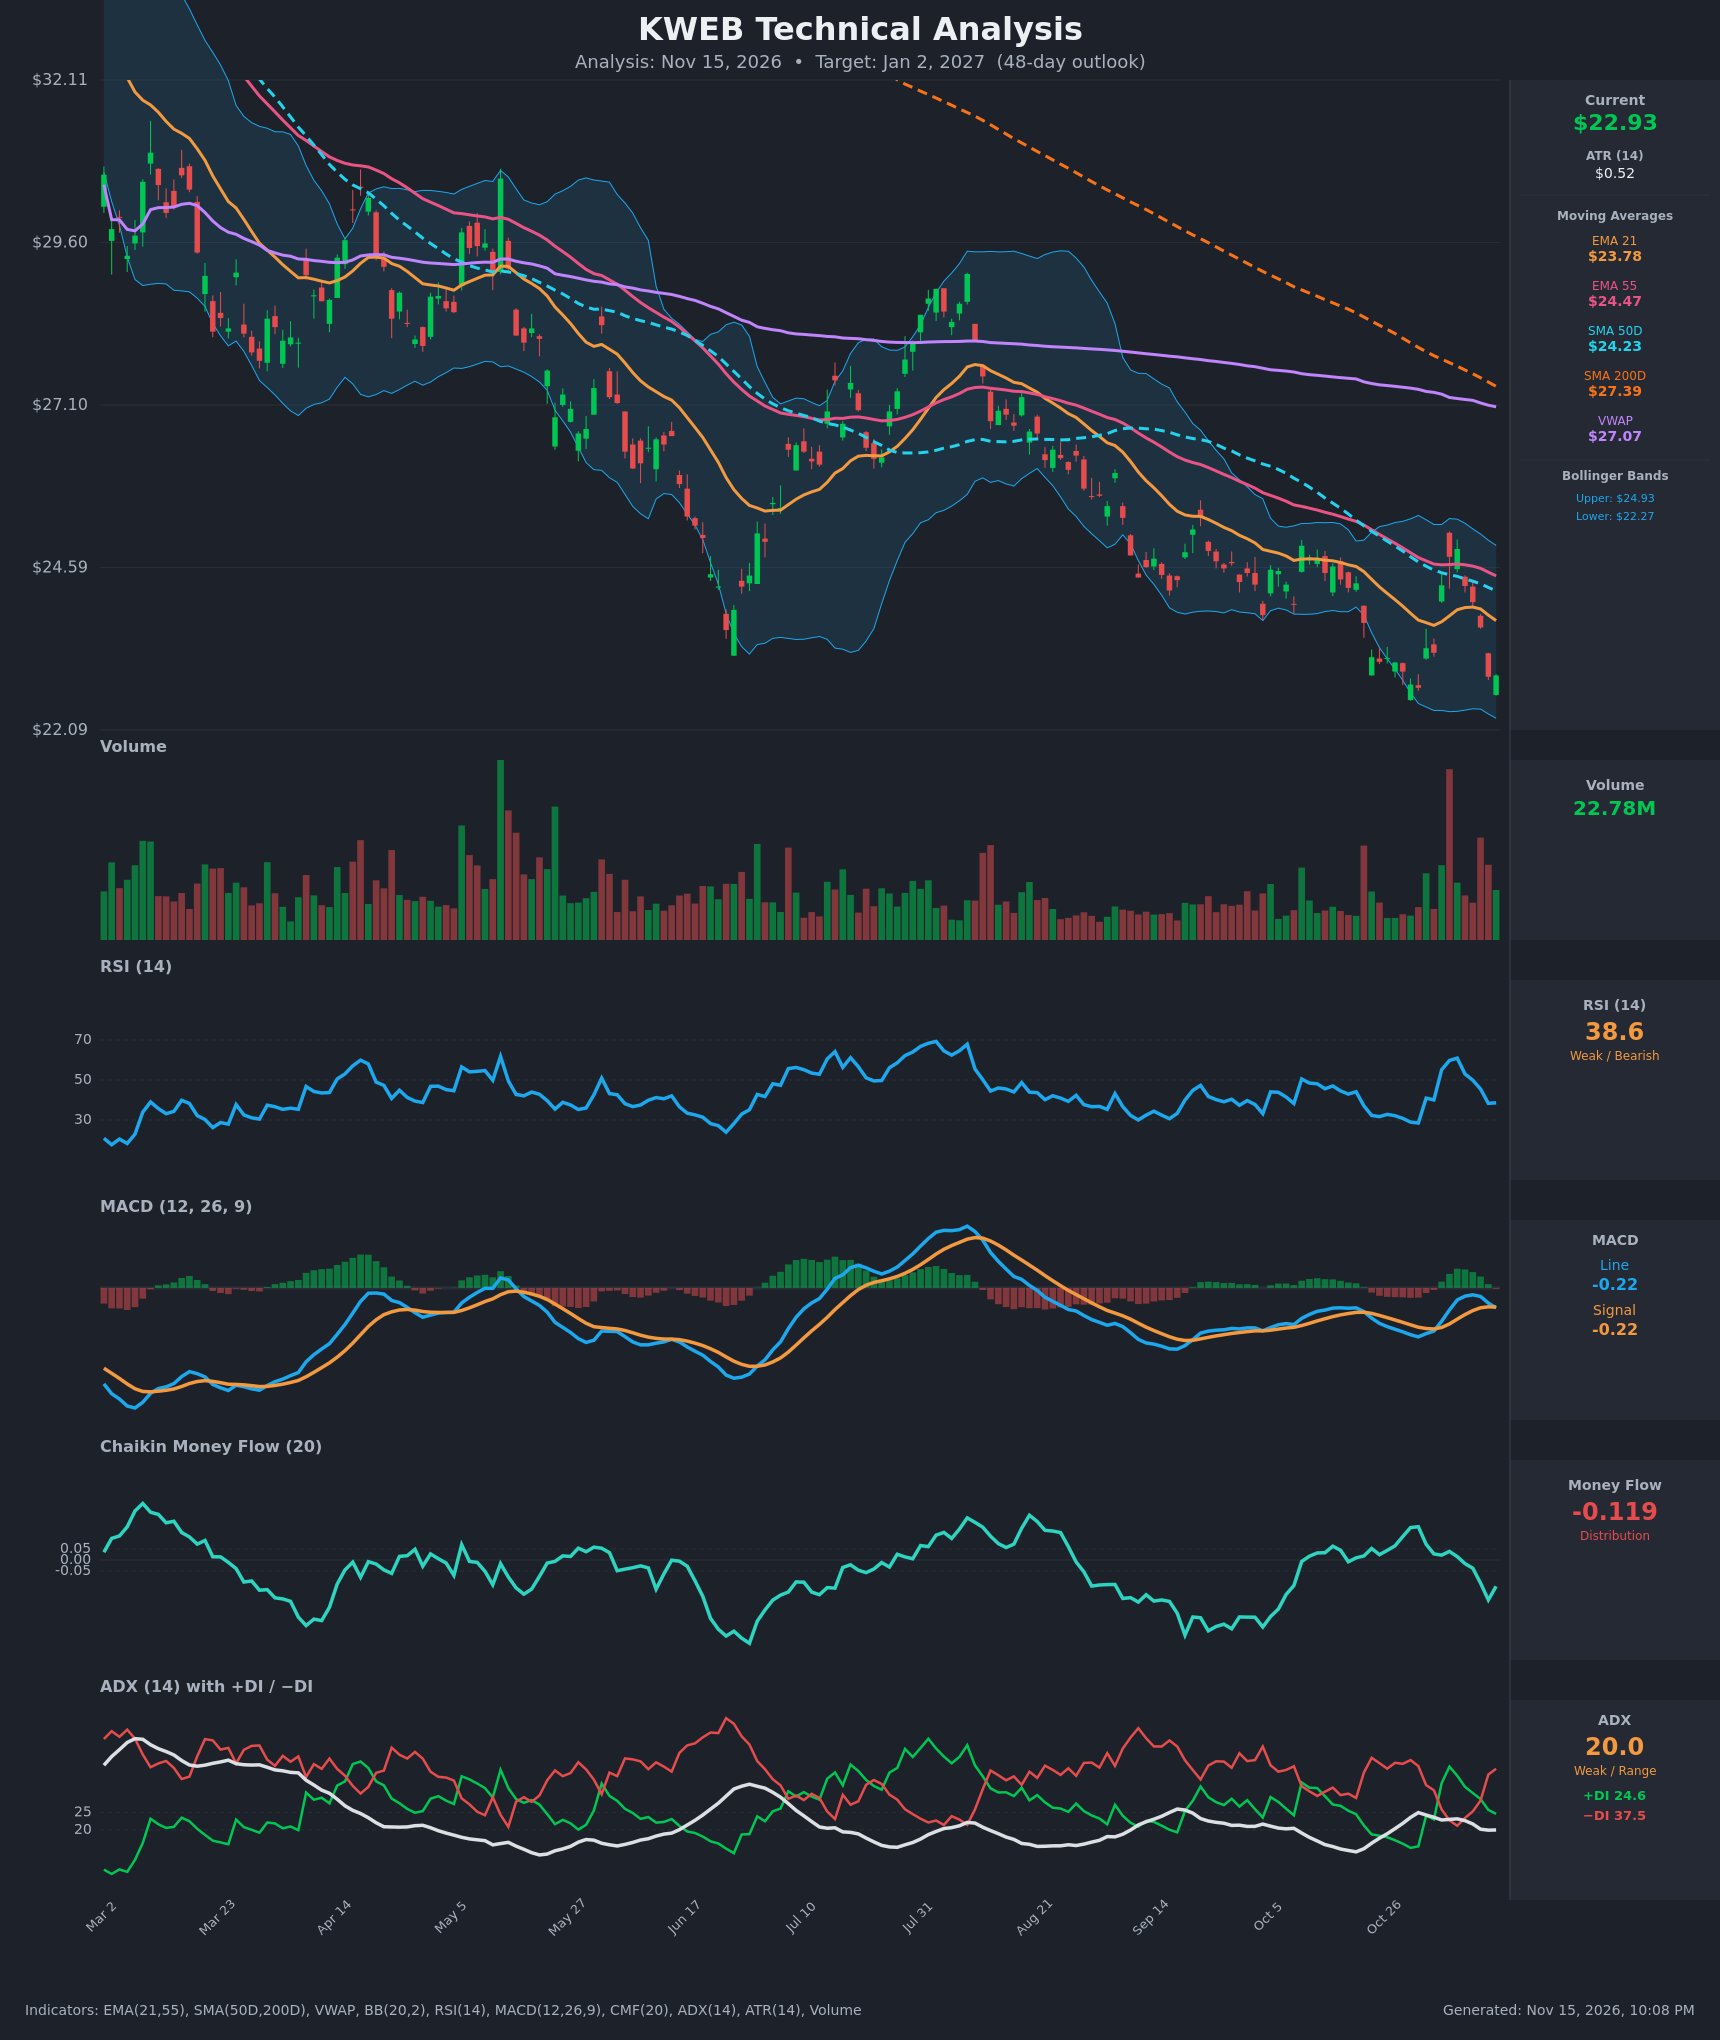
- RSI (14): 38.6, down from a 60.9 peak on Nov 6 and rolling over again after a brief bounce from 28.5 on Oct 30. It sits below 50 and above oversold, so momentum is weak with room to fall further. [Bearish]
- 20 EMA: The EMA 21 is $23.78 and price ($22.93) is below it, so it acts as resistance. EMA 21 is also below EMA 55 ($24.47), a bearish stack that has been in place for months. [Bearish]
- MACD: The line (-0.225) has just crossed below the signal (-0.215), a fresh bearish crossover. Both sit below zero and the histogram has turned slightly negative after the early-November bounce. [Bearish]
- Bollinger Bands (20): The bands run from $22.27 to $24.93 with a midline near $23.60. Price is in the lower third, about $0.66 above the lower band, and the bands are narrow, which points to compression. A tag of the lower band is plausible, and the band-walk lower in October was a sign of persistent weakness. [Bearish]
- CMF (20): -0.119, down from +0.15 on Oct 30 and well below the -0.05 threshold. Selling pressure is returning after a short accumulation phase. [Distribution]
- ADX (14): 20.0 with −DI (37.5) well above +DI (24.6). The trend is weak to borderline, but the directional bias is clearly down, and the −DI/+DI gap has widened over the last three bars. [Weak Trend, Bearish Direction]
- Volume: 22.78M on the latest bar, with heavy red-volume spikes on the sharp down days in late October and November. The Nov 4–6 rally had no sustained volume follow-through. Selling volume dominates on the large moves. [Bearish – distribution on declines]
DIVERGENCES & TRENDS
- No clear bullish divergence. Price is near its 52-week-type lows around $22.1–22.7, and RSI (38.6) and MACD are not making meaningfully higher lows on a multi-week basis. The Oct 30 RSI low of 28.5 was oversold, but the bounce to $24.88 failed under the declining EMA 55 and SMA 50D.
- All major moving averages are stacked bearishly: price ($22.93) < EMA 21 ($23.78) < SMA 50D ($24.23) < EMA 55 ($24.47) < VWAP ($27.07) < SMA 200D ($27.39).
- The SMA 50D is below the SMA 200D, so the death cross is long established. Price is about 16% below the SMA 200D, which confirms a long-term downtrend.
- MACD just crossed bearish (Nov 13), and the +DI/−DI gap has re-widened in favor of the bears. CMF has flipped from positive to clearly negative.
- The Nov 4–6 spike above the EMA 21 failed at roughly $24.9, which is the upper Bollinger Band and the SMA 50D/EMA 55 zone, so it was a bear-market rally that ended in a lower high.
CHART PATTERNS
- The long-term structure is a persistent downtrend of lower highs and lower lows. The recent price action since mid-September resembles a Bearish Pennant / Descending Triangle-style continuation. Price formed a lower high near $24.9 (Nov 6) and is again pressing lows near $22.3–22.7, which acts as a horizontal floor.
- A break below ~$22.3 would trigger the continuation. A measured move from the October-November range (~$22.3–$24.9, about $2.6) points to roughly $20–$20.50.
- The bullish alternative is a Double Bottom or base around $22.3–22.7 (Oct 30 low and the current test), which would need a close above $24.9 to confirm. That seems less likely given the indicators.
POTENTIAL SCENARIOS
- Scenario 1: Bearish Continuation Breakdown — Price fails the $22.3–22.7 support, the bearish MACD crossover extends and −DI stays dominant. Selling continues toward the measured-move area. Trigger: daily close below $22.27 (the lower Bollinger Band and the Oct 30 low) on rising volume. Target: $20.50–$21.00. Invalidation: a close above $24.00 (EMA 21/midline reclaim). (55% probability)
- Scenario 2: Neutral Base and Range — Support holds at $22.3 and price chops between $22.3 and $24.2 as ADX stays near 20. Trigger: repeated defense of the $22.3–22.7 zone with RSI holding above 30. Target: $23.00–$23.80. Invalidation: close below $22.20 or above $24.90. (25% probability)
- Scenario 3: Bullish Relief Rally — An oversold bounce with a double-bottom base lifts price back to the declining moving averages. Trigger: close above $24.00 with CMF turning positive. Target: $24.90–$25.50 (SMA 50D/EMA 55/upper band). Invalidation: close back below $22.60. (20% probability)
PRICE TARGETS
- Target Price: $21.60 (48-day timeframe, from $22.93)
- Expected Range: $19.40 to $24.40 (width $5.00, about 21.8% of price, in line with the 18–30% guidance for 61–180 days and slightly above the 12–18% band for 30–60 days, reflecting the elevated downside tail near a breakdown)
- Key Levels: Support at $22.27, Resistance at $23.78
OVERALL BIAS
OVERALL BIAS: BEARISH - Price is below every major moving average, MACD just crossed bearish, −DI dominates, CMF shows distribution at -0.119, and the November rally failed beneath the SMA 50D/EMA 55 cluster. A break of $22.27 support likely opens the way to the low $20s over the 48 days.
This is educational analysis and not financial advice.